The last chapter was about keeping a system healthy under load: spreading traffic across servers and capping what any one caller can demand. But all of that assumes you can see what is going on. When latency creeps up at 3am, or one endpoint starts returning errors, the first question is always the same: what is the traffic actually doing right now? This chapter is about answering that. You cannot keep a system healthy if you are blind to it.
The tools for this fall into three buckets, often called the three pillars of observability: logs, metrics, and traces. Each answers a different kind of question. We will read a real access log, name the HTTP numbers worth watching, follow a single request across services, and cover the one rule you must never break: do not log secrets.
Reading an access log line
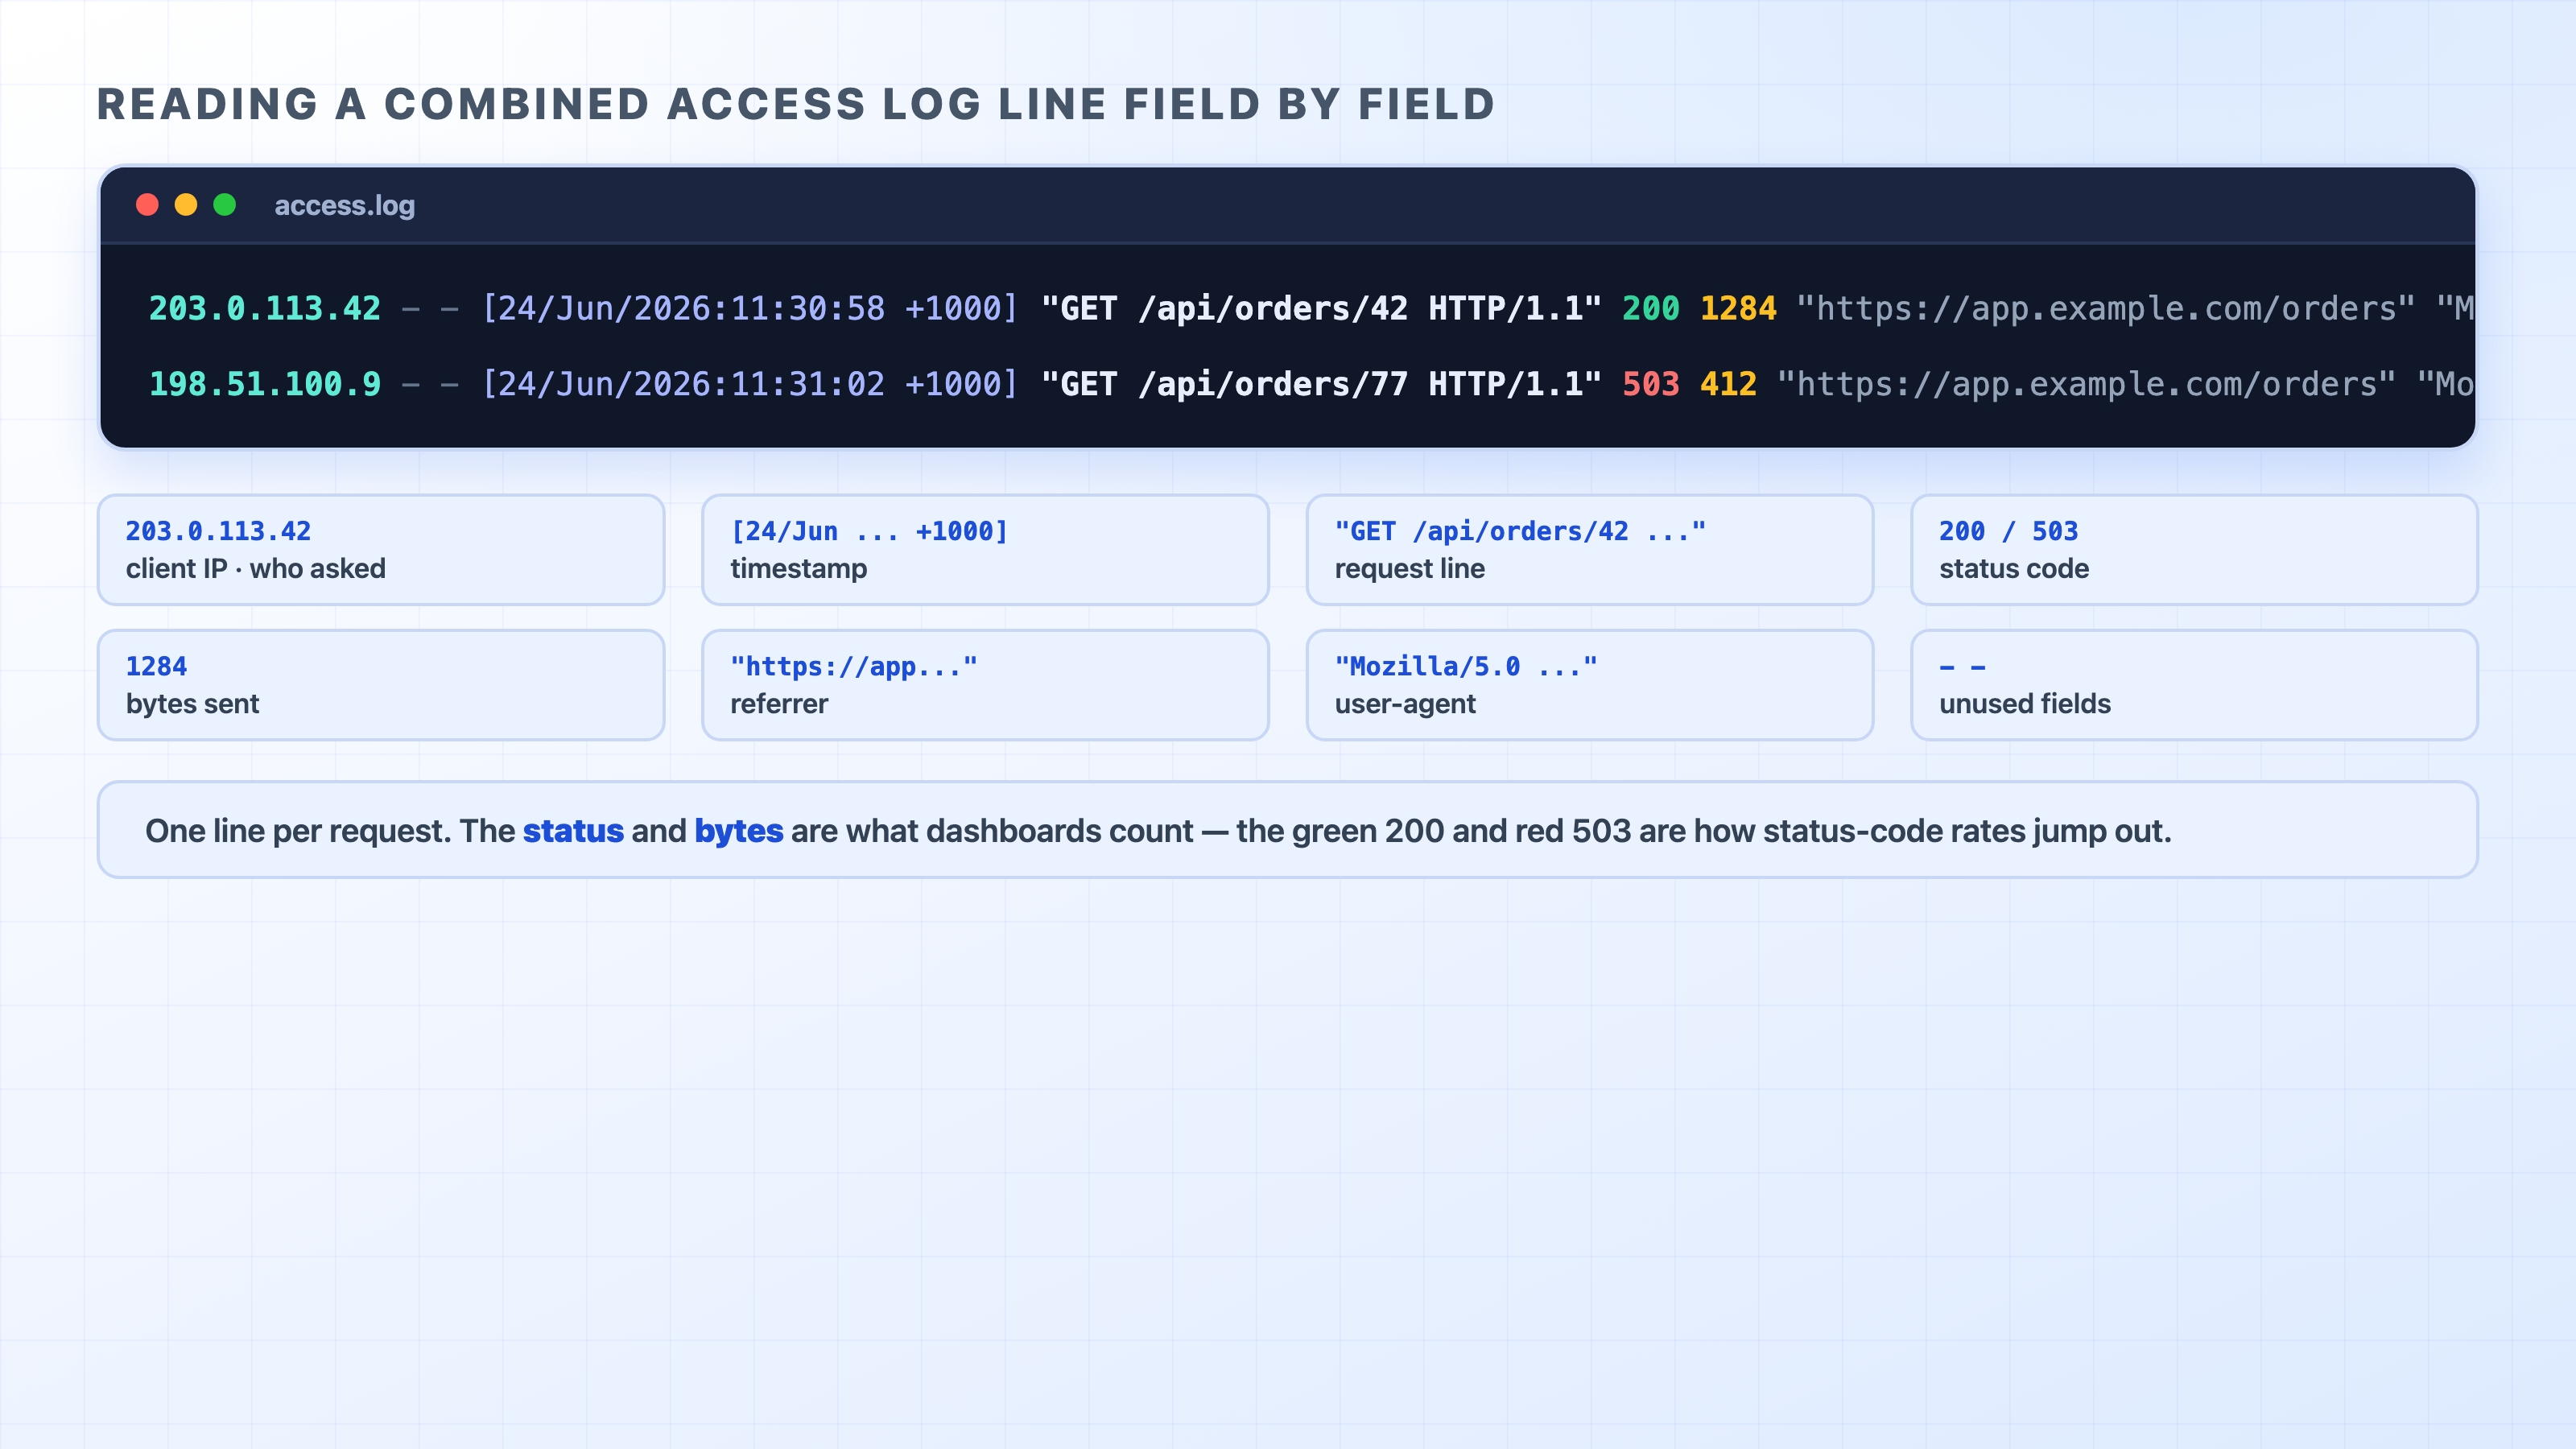
The oldest and simplest observability tool is the access log, a file where the server writes one line for every request it handles. Web servers like Nginx and Apache produce this by default. The most common shape is the combined log format, and once you can read one line, you can read millions of them.
Here is a single line in that format:
203.0.113.42 - - [24/Jun/2026:11:30:58 +1000] "GET /api/orders/42 HTTP/1.1" 200 1284 "https://app.example.com/orders" "Mozilla/5.0 (Macintosh; Intel Mac OS X 10_15_7)"
text
It looks dense, but it is just a fixed set of fields in a fixed order. Reading left to right:
203.0.113.42 — the client IP, who made the request. Behind a load balancer or CDN this may be the proxy's IP, which is exactly why the proxy adds X-Forwarded-For (we saw that in the reverse-proxy chapter).
- - — two fields rarely used today (identd and the authenticated user). A dash means "no value."
[24/Jun/2026:11:30:58 +1000] — the timestamp, when the server finished handling the request, with its UTC offset.
"GET /api/orders/42 HTTP/1.1" — the request line: method, path, and HTTP version. This tells you was asked for.
200 — the status code the server returned. This is the single most useful field for spotting trouble.
1284 — the number of bytes sent in the response body.
"https://app.example.com/orders" — the Referer header, the page the request came from.
"Mozilla/5.0 ..." — the User-Agent, what client made the request (a browser, curl, a bot).
A combined access log line with every field labelled
A log is a record of discrete events: one line per thing that happened, each with a timestamp. That is its strength and its weakness. When you need to know exactly what one request did, which path, which status, how big the response, the log has the answer. The trouble is volume. A busy service writes thousands of these lines per second, and no human reads them line by line. That is where the next two pillars come in.
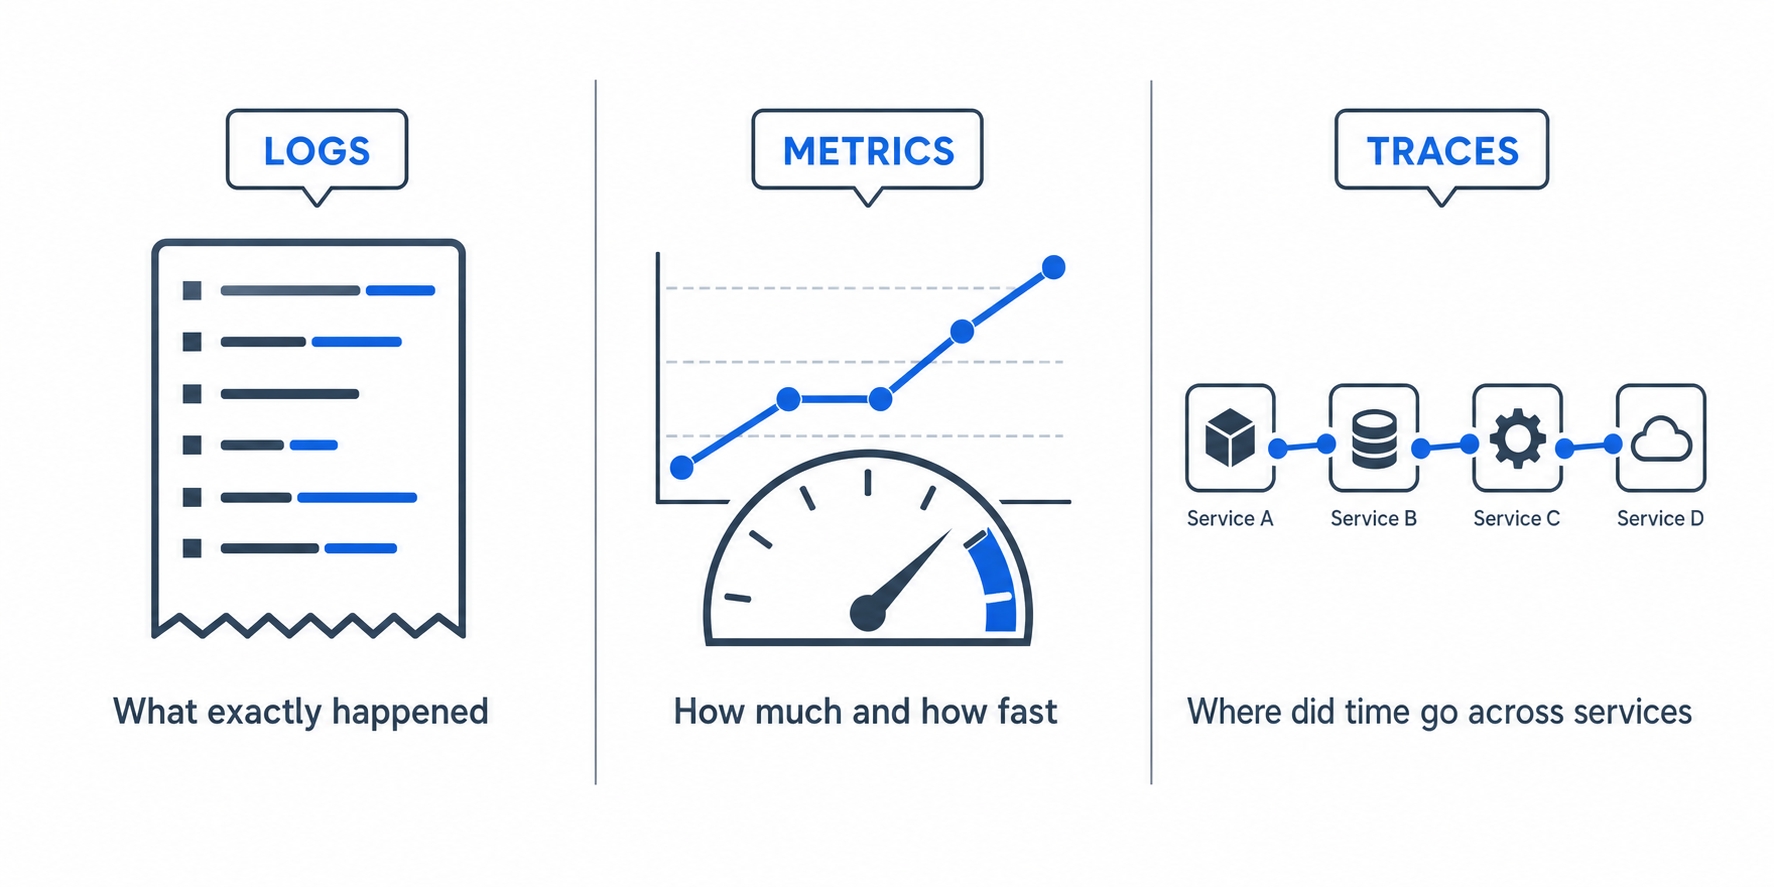
The three pillars: logs, metrics, traces
Logs are one of three complementary views. Each answers a different question, and you usually want all three.
Logs metrics and traces each answer a different question
Logs answer what exactly happened? They are discrete, detailed events: one line, one request, with full context. Perfect for digging into a specific failure ("show me every request that returned a 500 in the last hour"). They are poor for spotting trends, since you would have to count the lines yourself.
Metrics answer how much, and how fast? A metric is a number aggregated over time: requests per second, the error rate, the 95th-percentile response time. Instead of storing every event, a metrics system keeps running totals and summaries, so it is cheap to keep for a long time and easy to chart. This is what powers the dashboards and alerts that tell you "5xx errors just jumped," usually built by counting access-log fields like the status code.
Traces answer where did the time go, across services? In a system made of several services, one user request might hop from an API gateway to an orders service to a payments service to a database. A trace stitches those hops together into one timeline so you can see which step was slow. A log line only shows you one service's view; a trace shows the whole journey.
A quick way to keep them straight: logs are for one event in detail, metrics are for many events summarized, and traces are for one event across many services. They overlap, and good tooling links them, but each one shines on a different question.
The HTTP metrics worth watching
You could measure a hundred things. For HTTP traffic, three families of metrics carry most of the signal.
Status-code rates. Group responses by their status range and watch the proportions. A rising 5xx rate (server errors) means your own code or infrastructure is failing, and that is the alarm that should wake someone up. A rising 4xx rate (client errors) is more subtle: a spike in 404s might mean a broken link or a bad deploy, and a spike in 429s means clients are hitting your rate limits. The ratio of errors to total requests is usually more useful than the raw count, because the count naturally rises with traffic.
Latency percentiles. How long requests take. The key idea here is that averages lie. If 99 requests take 10ms and one takes 5 seconds, the average is about 60ms, which sounds fine, yet one user just waited 5 seconds. Percentiles tell the real story. p50 (the median) is the typical experience: half of requests are faster, half slower. p95 means 95% of requests are at least this fast, so 1 in 20 is slower. p99 captures the worst 1%. Production teams watch p95 and p99 closely, because the slow tail is where real users feel pain and where the average hides it.
Throughput. How many requests you are handling, usually measured in requests per second. On its own it is a measure of load, but it gives the other two numbers their context. A 1% error rate means something very different at 10 requests per second than at 10,000.
A common confusion: a healthy average latency with a bad p99 is not a contradiction. It is the normal state of almost every real system. Watch the tail, not the mean.
Following one request: request IDs and tracing
When a request fails and it touched five services, you need to find that request's footprint in five different logs. Searching each log by timestamp is painful and unreliable, because many requests share the same instant. The fix is to give every request a unique label and carry it everywhere.
That label is a request ID, a unique string generated when a request first arrives, commonly passed in a header named X-Request-ID (or X-Correlation-ID). The first server to see the request generates the ID if there isn't one, writes it into its own logs, and passes it along in the header to every downstream service it calls. Each service does the same: log the ID, forward the ID. Now one search for that single ID pulls up every log line from every service for that exact request.
This is the foundation of distributed tracing. A trace takes that shared ID, attaches a timestamp and duration to each hop (each hop is called a span), and assembles them into one timeline. The result shows you not just that a request was slow, but which service made it slow: maybe the API itself was fast and a downstream database query ate 800ms. Without a shared ID you are guessing; with one you are reading.
You do not have to build this by hand. Reverse proxies can add X-Request-ID automatically, and tracing libraries propagate it for you. The thing to understand is the mechanic: one ID, generated once, carried through every hop, written to every log.
The rule you cannot break: never log secrets
Logs are useful precisely because they capture the details of a request. That is also what makes them dangerous. A request carries credentials, and if you log the whole request, you log the credentials too.
Back in the authorization chapter we saw that a request authenticates itself with the Authorization header (Authorization: Bearer <token>) or a session Cookie. Those headers are the keys to the account. Write them into a log file, and now anyone who can read that log holds a working credential: a teammate, a log-aggregation service, or an attacker who breaches your logging pipeline. Real companies have leaked live API keys and session tokens this way, simply because a debug log dumped full request headers and that log was later exposed.
So there is a short list of things you must keep out of logs:
Authorization headers — they carry tokens, API keys, and Basic-auth credentials.
Cookie and Set-Cookie headers — a session cookie is as good as a password.
Passwords and tokens in request bodies — a login POST or a password-reset payload.
Personally identifiable information (PII) — emails, full names, addresses, payment details, depending on what your privacy rules require.
The fix is redaction: before a value is written, replace the sensitive part with a placeholder. A logged header should look like Authorization: Bearer [REDACTED], not the real token. Most logging libraries let you register a redaction list so this happens automatically, which matters because the safest approach is to never let the raw value reach the log in the first place. When you set up logging for a new service, decide what gets redacted before you turn it on, not after the first leak.
Try it now
A metrics system records numbers like status and timing for every request. You can print those same numbers for a single request yourself with curl's -w (write-out) flag, which prints chosen fields after the response. The -s -o /dev/null part keeps it quiet and throws away the body, so you see only the measurements:
That is one data point a dashboard would record: a 200, a total time of about 39ms, and a 559-byte response. Run it a hundred times and you would have the raw material for a throughput number, a 5xx rate, and a latency distribution.
curl can also break the timing down by phase, which is what a trace does at a higher level: showing where the time actually went.
Each number is cumulative from the start of the request: DNS finished at ~3ms, the TCP connection at ~13ms, the first byte arrived at ~40ms, and the whole thing was done at ~40ms. This is the same kind of breakdown a tracing span gives you, just for one hop instead of a whole distributed request. We will lean on this -w trick again in the debugging section.
What's Next
That closes Production HTTP. The next section turns to debugging, starting with the browser's Network panel, your fastest tool for seeing exactly what a request did.