A server can answer a request, route it to the right site, and send the client elsewhere. But all of that assumes one server, calmly handling whatever shows up. Production rarely looks like that. Traffic spikes, machines crash, and one badly-behaved client can try to make a thousand requests a second. This chapter covers the two tools that keep things standing: load balancing, which spreads traffic across many servers, and rate limiting, which caps how much any single caller can demand.
They solve different problems, but they pair naturally. Load balancing lets you grow sideways and survive failures. Rate limiting protects whatever is behind it from being swamped. Most real systems run both.
Load balancing: one address, many servers
A single server has a ceiling. There is only so much CPU, memory, and bandwidth in one box, and when you hit that ceiling the usual fix is not a bigger box. It is more boxes. You run several identical copies of your app and put something in front of them that decides which copy answers each request. That something is a load balancer — a piece of software (or a managed cloud service) that takes incoming requests and distributes them across a pool of backend servers.
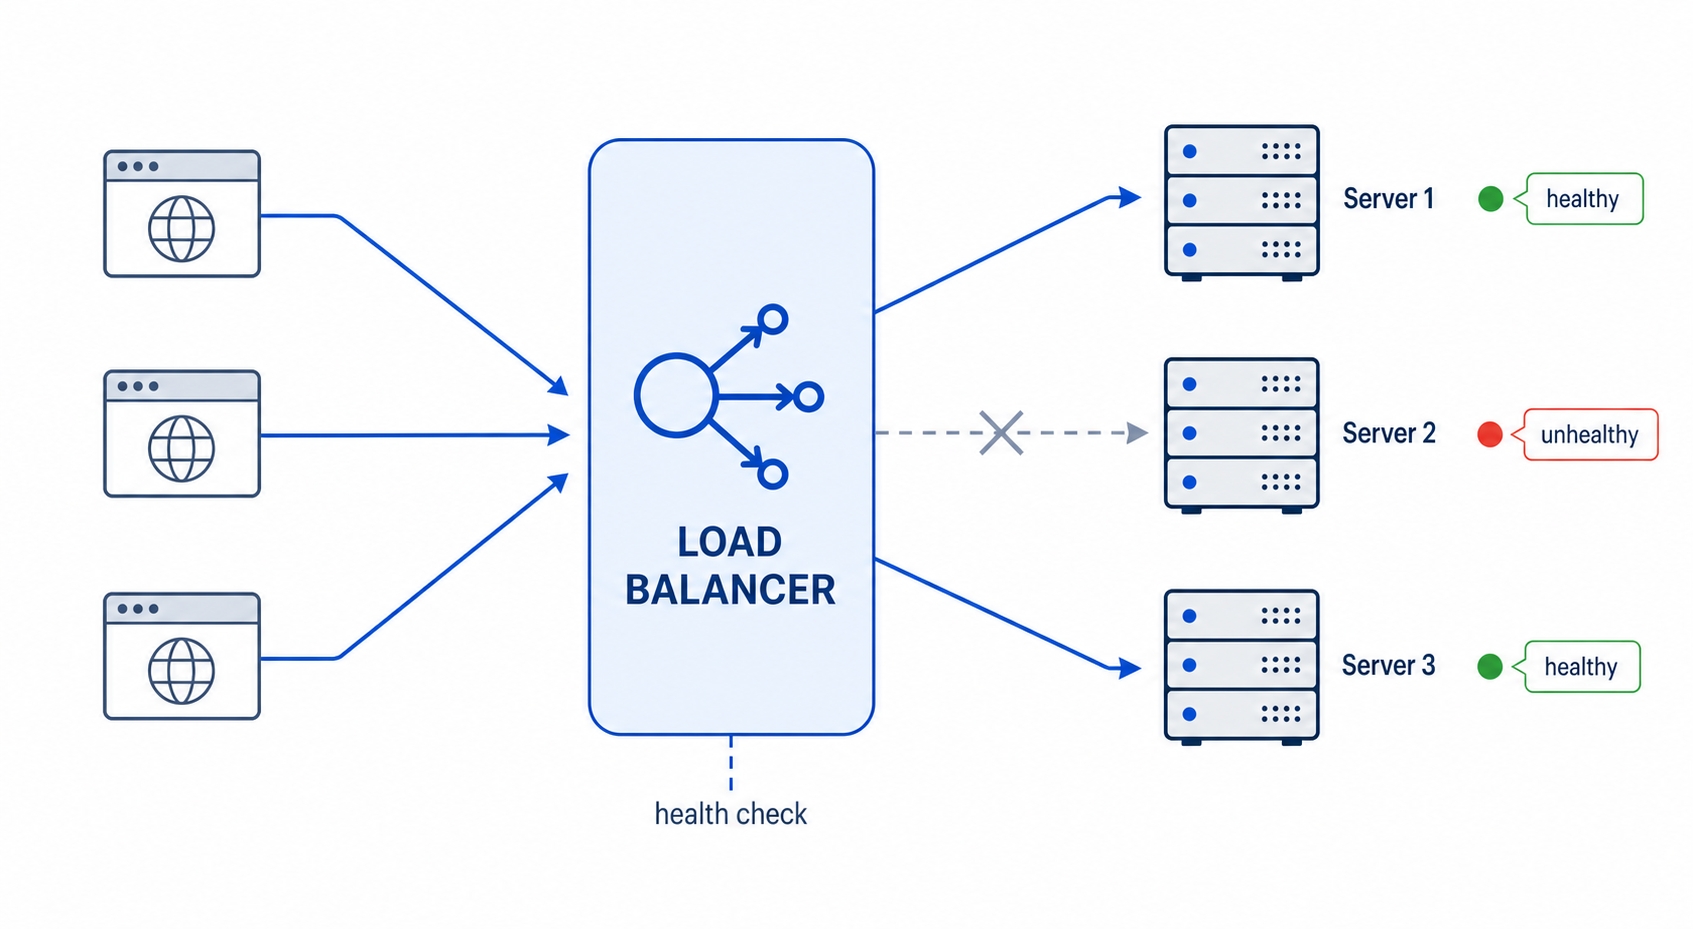
This is almost always the reverse proxy from the architecture section wearing a second hat. The clients connect to one public address. Behind it sit Server 1, Server 2, Server 3, and so on, and the load balancer picks one per request. The clients never know how many servers there are, and you can add or remove servers without anyone outside noticing.
A load balancer spreads requests across three backends and skips an unhealthy one
Spreading traffic this way buys you two things at once:
Horizontal scale. Need to handle more traffic? Add more servers to the pool. The load balancer starts sending them work immediately. This is "scaling out" (more machines) instead of "scaling up" (a bigger machine), and it has no hard ceiling.
Surviving a failure. If one server crashes, the load balancer notices and stops sending it requests. The others absorb the load. From the outside, the site stays up even though a machine just died.
That second point only works if the load balancer can tell a dead server from a live one. We will get to that in a moment. First, how does it decide which server to pick?
Load Balancing and Rate Limiting in HTTP | dalabs.academy
How the load balancer picks a server
There are several strategies, and you usually just choose one in your load balancer's config. Three cover the vast majority of cases.
Round-robin is the simplest: hand request 1 to Server A, request 2 to Server B, request 3 to Server C, then back to A, and keep cycling. It is easy to reason about and spreads requests evenly by count. The catch is that it treats every request as equal. If one request happens to be a slow report that ties up a server for ten seconds while the next is a quick health check, round-robin does not care. It just keeps dealing cards in order.
Least-connections is smarter about uneven work. Instead of going in order, the load balancer sends each new request to the server currently handling the fewest open connections. A server stuck on slow requests naturally has more connections open, so it gets skipped until it catches up. This handles mixed workloads better, which is why it is a common default.
Hashing picks the server by computing a hash of something stable about the request, most often the client's IP address (or a key like a user ID). The same input always hashes to the same server, so a given client keeps landing on the same backend. That property is the whole point: it gives you consistency. The trade-off is that distribution can get lumpy if a few clients send most of the traffic, since they are all pinned to the same place.
That last one connects directly to a problem we met back in the sessions chapter.
Sticky sessions, and why a shared store frees you
Remember the trouble with in-memory sessions. A user logs in, Server A creates a session in its own memory, and the next request lands on Server B, which has never heard of that session. The user looks logged out. Load balancing is exactly what causes this: by design, consecutive requests can go to different servers.
There are two ways out, and we saw both in the sessions chapter.
The first is sticky sessions, also called session affinity. You tell the load balancer to pin each user to one server, usually with IP hashing or a special cookie, so all of that user's requests go to the same backend that holds their session. It works, but it has real downsides. If that one server dies, every user pinned to it loses their session and gets logged out. And because traffic is now tied to specific servers, the load balancer can no longer rebalance freely, so a busy server can stay busy while others sit idle.
The second is a shared session store — keep session data in something all servers can reach, like Redis, instead of in any single server's memory. Now it does not matter which backend answers a request. Server B can look up the session just as well as Server A. The servers become interchangeable, and the load balancer is free to use plain round-robin or least-connections without worrying about affinity. This is why the shared store is the more common production choice: it removes the constraint instead of working around it.
The general lesson is worth holding onto: load balancing works best when your servers are stateless, meaning any server can handle any request. Keep state out of the individual servers and the load balancer's job gets a lot simpler.
Health checks: pulling a dead server out of rotation
Surviving a failure depends on noticing one. The load balancer does this with a health check: it periodically sends a small request to each backend, often a GET to a path like /health, and watches the response. A healthy server answers quickly with a 200. A server that returns an error, or does not answer within a timeout, is marked unhealthy and pulled out of rotation. No new requests go to it until it starts passing checks again.
This is why a single crashed server does not take the site down. Within a few seconds the load balancer notices the failed checks, stops routing to that server, and spreads the load over the rest. When the server recovers and starts answering /health with 200 again, it gets added back automatically.
A good health endpoint is cheap and honest. It should not do heavy work, or the checks themselves become a load problem. But it should reflect real readiness. If your app cannot reach its database, a health check that only returns "the process is running" will keep a broken server in rotation. Many systems split this into a liveness check (is the process alive?) and a readiness check (can it actually serve traffic right now?), but the core idea is the same: give the load balancer a reliable signal so it can route around trouble.
Rate limiting: capping what any one caller can demand
Load balancing helps you handle more traffic. Rate limiting is about handling it fairly — and about saying no when you have to. A rate limit is a cap on how many requests a given caller can make in a given amount of time, for example "60 requests per hour per IP address." Go over the cap and the server rejects the extra requests instead of serving them.
Why bother? Three reasons, and you usually care about all of them at once:
Fairness. One client hammering your API can starve everyone else. A per-client limit keeps a single heavy user from degrading the service for the rest.
Cost control. Every request costs something — CPU, a database query, maybe a paid third-party call. A runaway client (often a buggy loop) can run up real money. A limit puts a ceiling on the bill.
Abuse and overload protection. Rate limiting is a front-line defense against scrapers, credential-stuffing attacks, and accidental denial-of-service from a misbehaving client. It does not stop a large distributed attack on its own, but it absorbs a lot of the everyday abuse cheaply.
The interesting question is how you count. "60 requests per hour" sounds simple until you ask: per hour starting when? Three common algorithms answer that differently.
Counting algorithms, and the trade-off each makes
Fixed window is the simplest. Divide time into fixed buckets — say, each clock hour — and count requests in the current bucket. At the top of the hour the count resets to zero. Easy to build and cheap to run, but it has a well-known edge problem: a client can send the full limit in the last second of one window and the full limit again in the first second of the next, getting double the allowance across that boundary.
Sliding window smooths that out by counting requests over the last N minutes from right now, rather than within a fixed bucket. There is no boundary to game, because the window is always moving with you. The trade-off is that it costs a bit more to track, since the server has to account for requests as they age out of the window rather than just resetting a counter.
Token bucket is the one you will see most in practice, because it allows bursts gracefully. Picture a bucket that holds a fixed number of tokens and refills at a steady rate, say one token per second up to a maximum of 60. Each request spends one token. If the bucket has tokens, the request goes through; if it is empty, the request is rejected until more tokens drip in. A client that has been quiet builds up a full bucket and can burst through 60 requests at once, then settles into the steady refill rate. That mix — short bursts allowed, sustained rate capped — matches how real clients behave, which is why it is so common.
You do not usually implement these yourself. Your reverse proxy, API gateway, or a library does it. But knowing which one is in play explains the behavior you see: whether bursts are allowed, and exactly when your budget refills.
How a server tells you it's rate limited
When you hit the cap, the server needs to tell you, and HTTP has standard signals for it. The status code is 429 Too Many Requests. It is in the 4xx family, which means it is a client error: the server is fine, you are simply asking too often. Slow down and the same request will work.
A 429 on its own leaves you guessing how long to wait, so servers add headers. The most important is Retry-After, which tells the client exactly how long to hold off. It comes in two forms — a number of seconds (Retry-After: 30) or an absolute date — and it can also appear on a 503 Service Unavailable when a server is temporarily overloaded. When it is present, honor it. It is the server telling you precisely when to come back.
Servers also expose your remaining budget before you hit the limit, so a well-behaved client can pace itself. You will see two common header families that carry the same idea:
The widely-used X- convention: X-RateLimit-Limit (your total budget for the window), X-RateLimit-Remaining (how many requests you have left), and X-RateLimit-Reset (when the window refills, usually as a Unix timestamp).
A newer standardized form that drops the X- prefix: RateLimit-Limit, RateLimit-Remaining, and RateLimit-Reset. Both mean the same thing; you will run into both in the wild.
Read those headers and you never have to be surprised by a 429. When Remaining is getting low, ease off until Reset passes.
Try it now
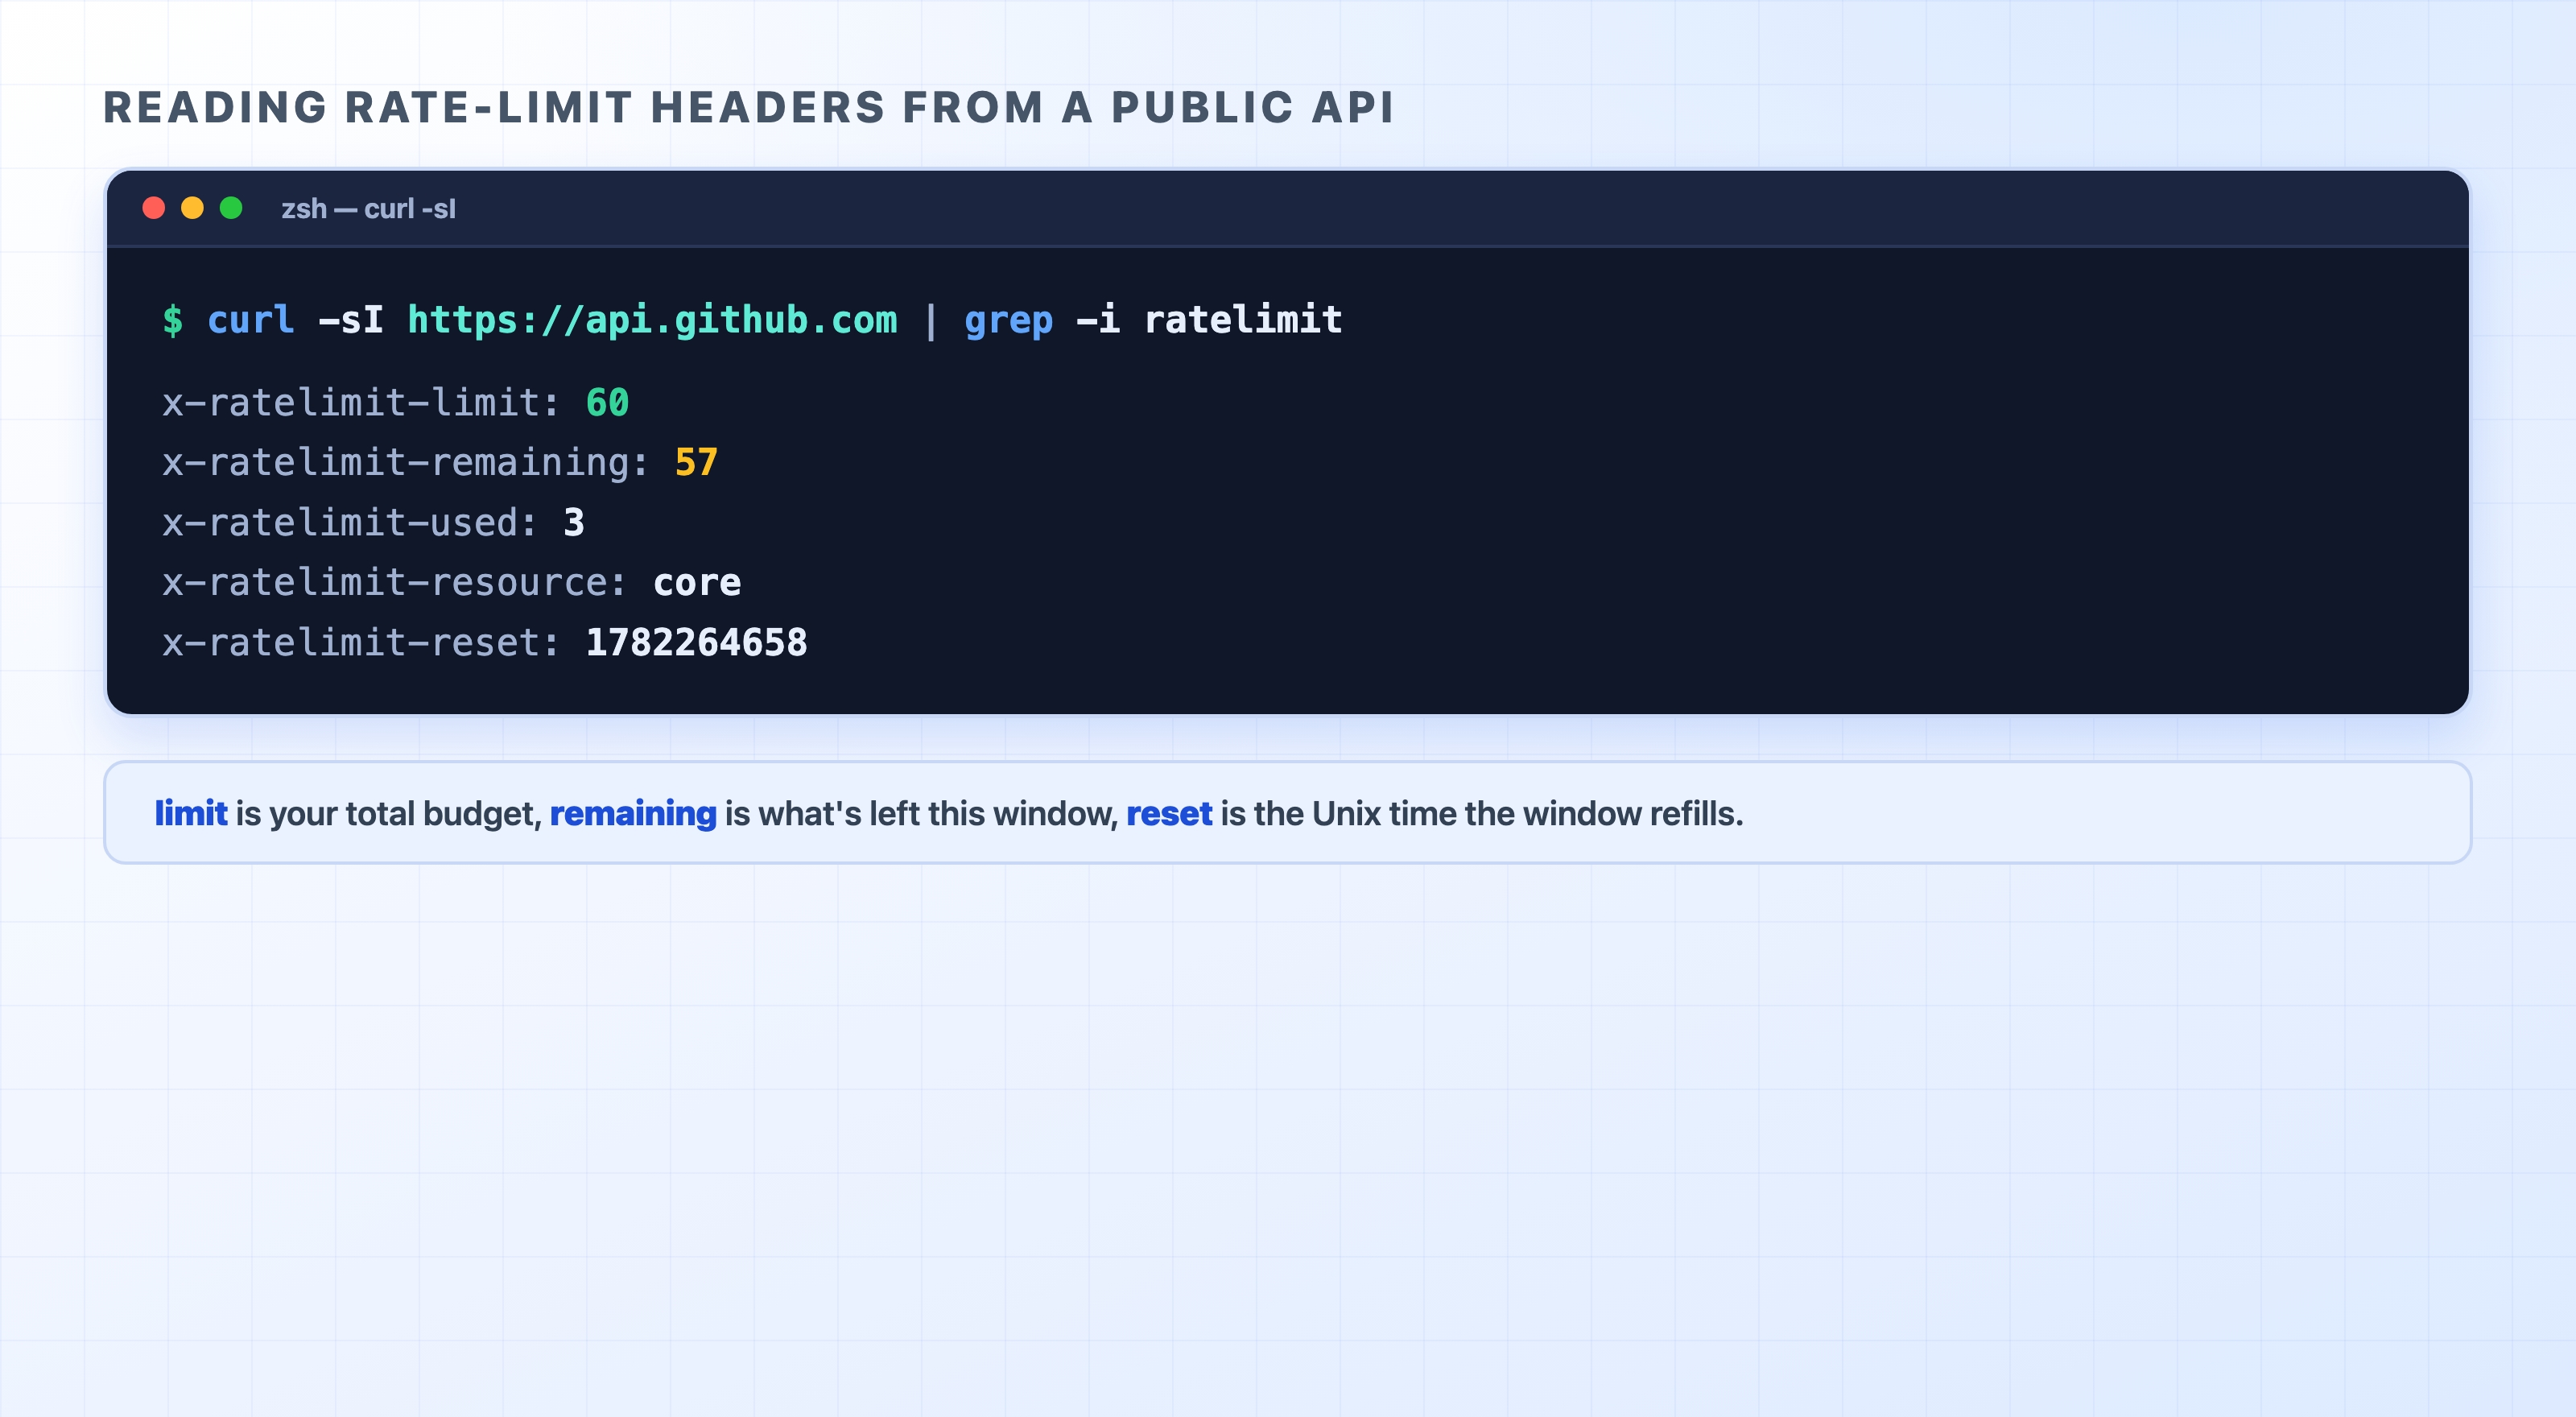
GitHub's public API returns these headers on every response, even without authentication, so you can read a real rate limit right now. The -sI flags tell curl to fetch only the headers quietly (-s for silent, -I for a HEAD-style request), and grep filters down to the lines we care about:
There it is, live. Unauthenticated callers get a budget of 60 requests, and this response shows 57 left with 3 already used. The x-ratelimit-reset value is a Unix timestamp — the moment the window refills back to 60. You can decode it to a human time:
date -r 1782264658
bash
Wed Jun 24 11:30:58 AEST 2026
text
curl reads GitHub's live rate-limit headers
Run the curl command a few times and watch x-ratelimit-remaining tick down and x-ratelimit-used tick up. That is the rate limiter counting your requests in real time. If you ever drove it to zero, the next request would come back 403 or 429 with a Retry-After, and you would have to wait for the reset.
A note on the header prefix. GitHub uses the older X-RateLimit-* names here, but newer APIs increasingly use the prefix-free RateLimit-* form. If a grep -i ratelimit turns up nothing on some other API, try grep -i 'rate' — the limit might be expressed under a slightly different name, or only sent once you are actually authenticated.
Being a polite client
If you write code that calls an API, you are on the other side of all this, and how you behave matters. The rule of thumb is simple: do not hammer.
When you get a 429, the worst thing you can do is immediately retry. That just adds load to a service that is already telling you to back off, and your retries get rejected too. Instead, back off: wait, then try again, and wait longer each time it keeps failing. This is exponential backoff — wait 1 second, then 2, then 4, then 8, doubling the delay on each failed attempt so a struggling server gets room to recover.
There is one refinement worth knowing. If many clients all back off on the same schedule, they will retry at the same instants and slam the server in synchronized waves. The fix is jitter: add a small random amount to each wait so the retries spread out instead of clumping. Exponential backoff with jitter is the standard, well-tested pattern, and most HTTP client libraries can do it for you.
And above all, if the response carried a Retry-After, honor it. The server told you exactly when to come back. Waiting that long is both the polite move and the one most likely to succeed.
What's Next
You can now spread traffic across servers and keep any one caller from overwhelming them. The next chapter looks at how you actually see what your HTTP traffic is doing in production, through logs, metrics, and traces.