Debugging the Full HTTP Request Path | dalabs.academy
Debugging the Full Request Path
Tung Nguyen
··
13 min read
This is the last working chapter of the course, and it pulls the whole thing together. Over the last two chapters you got the tools to see a request and a field guide to the errors they surface. Now we put them to work on the hardest kind of problem: "the site is broken" with no error code to start from. The skill here isn't any one command. It's a habit: when something breaks, walk the request path in order instead of guessing.
Most debugging time is lost guessing at the wrong layer
A request to a website is not one thing that either works or doesn't. It's a chain of layers, each handing off to the next. The name has to resolve to an IP. A TCP connection has to open to that IP. TLS has to negotiate a trusted certificate. The proxy at the edge has to accept the request and reach your origin. The origin app has to run your code and answer. Any one of those can fail, and when it does, the page just doesn't load.
The trap is that the symptom looks the same no matter which layer broke. A spinning tab tells you nothing about whether it's DNS, a dead server, or an expired certificate. So people guess. They restart the app server when the real problem is stale DNS. They redeploy when the certificate quietly expired at midnight. They blame the network when their app is throwing 500s. Hours disappear into the wrong layer.
The whole course has been building one mental model to beat this: HTTP sits on top of a stack of layers, and each layer has a clear job. That model is exactly what turns a vague "it's broken" into a short, ordered checklist. You don't have to be clever. You have to be systematic.
The request path checked one layer at a time with a tool for each
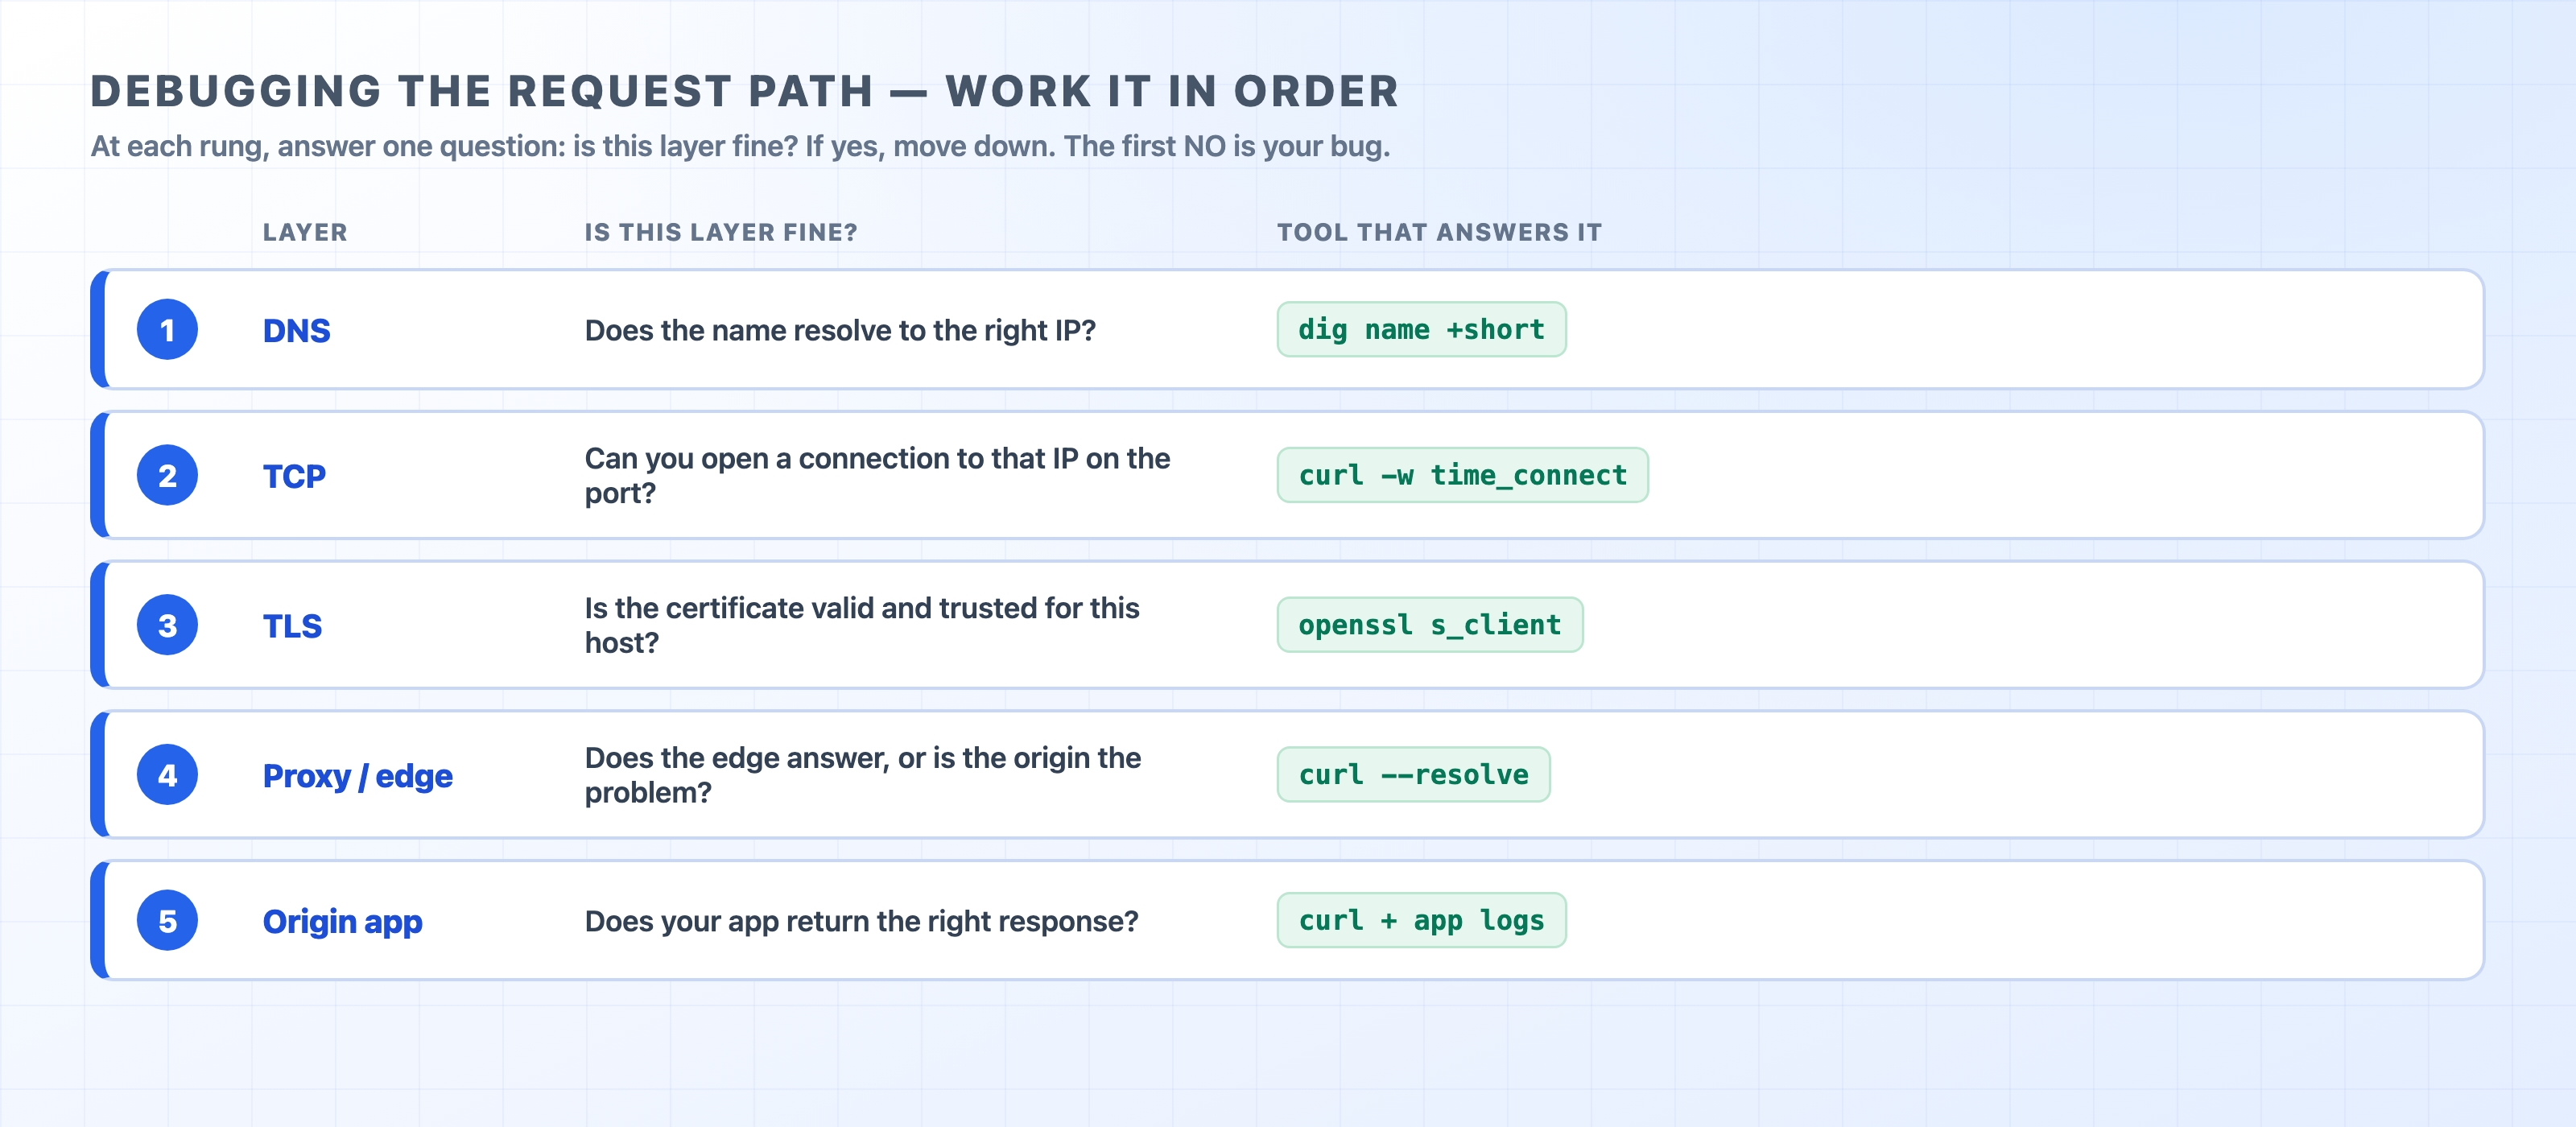
Work the path in order
Here is the order, and it matters. Each layer depends on the one before it, so you check from the bottom of the stack up toward your code. The first layer that fails is your bug, and everything below it was a red herring.
DNS — does the name turn into the right IP address?
TCP — can you open a connection to that IP on that port?
— is the certificate valid and trusted for this host?
Proxy / edge — does the thing in front of your servers answer, and is it the proxy or the origin that's wrong?
Origin app — does your application return the right response?
At each rung you ask one yes/no question: is this layer fine? If yes, you've eliminated it and you move down. If no, stop, you've found where the request dies. The point of going in order is that a failure low in the stack makes everything above it look broken too. If DNS gives you the wrong IP, the connection, the certificate, and the app will all look wrong even though they're perfectly healthy. Fix the bottom first and the noise above it disappears.
Let me show each rung with the one command that answers it, then run the whole sequence against a real bug.
Layer 1 — DNS: does the name resolve, and to the right IP?
DNS turns example.com into an IP address. If it returns nothing, the wrong address, or a stale one, nothing else can work. This is the most common "mystery" cause because DNS changes are cached at every level and take time to propagate, so a record you updated an hour ago might still be serving the old value to some users.
The tool is dig (or nslookup on Windows). Ask it what the name resolves to:
dig example.com +short
bash
104.20.23.154
172.66.147.243
text
You get back the IP (or IPs) the name points at right now. Two questions: did you get an answer at all, and is it the address you expect? If dig returns nothing, the name doesn't resolve, the bug is DNS, and you stop here. If it returns an IP but it's the old one after a recent change, that's stale DNS, also a DNS problem, not your app. If the IP looks right, DNS is fine and you move down a layer.
A common confusion: people see a working site on their own machine and assume DNS is fine for everyone. But your machine may be answering from a cache. When a change "works for me but not for them," a stale cached record on one side is a prime suspect. That's the exact bug we'll chase below.
Layer 2 — TCP: can you reach that IP on the port?
You have the right IP. Can you actually open a connection to it? This is the TCP three-way handshake from the network section: if the server is down, the port is closed, or a firewall is dropping packets, the connection never completes and the request can't even begin.
The curl -w timing breakdown answers this without you needing a packet sniffer. It prints how long each phase took:
Read it as cumulative milestones, not separate durations. time_namelookup is when DNS finished, time_connect is when the TCP handshake finished, time_appconnect is when TLS finished, and time_starttransfer (TTFB, time to first byte) is when the first byte of the response arrived. The gap between any two is where that phase's time went.
For TCP specifically, look at connect. If connect never completes, the handshake failed, the bug is at the network or port layer, and you stop here. If connect finishes but then everything stalls, TCP is fine and the problem is higher up. This same breakdown is your performance tool too: a slow page where most of the time sits between connect and ttfb is a slow server, not a slow network.
Layer 3 — TLS: is the certificate valid and trusted?
The connection opened, but the page still won't load and the browser is warning about security. Now you're at TLS. A certificate can be expired, issued for the wrong hostname, self-signed, or missing an intermediate in its chain, and any of those breaks HTTPS even though DNS and TCP are perfect.
openssl s_client opens a raw TLS connection and shows you exactly what the server presented:
i:C=US, O=SSL Corporation, CN=Cloudflare TLS Issuing ECC CA 3
v:NotBefore: May 31 21:39:12 2026 GMT; NotAfter: Aug 29 21:41:26 2026 GMT
1 s:C=US, O=SSL Corporation, CN=Cloudflare TLS Issuing ECC CA 3
i:C=US, O=SSL Corporation, CN=SSL.com TLS Transit ECC CA R2
text
The -servername flag sends SNI, which tells a server hosting many sites which certificate you want, so always include it. Read three things: the subject (s:) should match the host you asked for, the NotAfter date should be in the future, and the chain should climb to a trusted root. The cleanest signal is the verify line at the very end of the full output:
0 (ok) means your machine trusts the chain. Anything else, an expired cert, a hostname mismatch, an untrusted issuer, names the TLS problem precisely. If it's OK, TLS is fine and you keep going.
Layer 4 — Proxy or edge: is it the front door or the origin?
In production your request almost never hits your app directly. It goes through a reverse proxy or CDN edge first, and that machine can return errors of its own. The errors chapter covered the headline pair: a 502 means the proxy got a broken reply from the origin, a 504 means the origin never answered in time. Both are emitted by the proxy about the origin behind it. So the key question at this layer is: is the edge broken, or is it faithfully reporting that the origin is broken?
The way to split them is to take the proxy out of the loop and talk to the origin directly. curl --resolve lets you keep the real hostname (so TLS and the Host header still work) while pointing the connection at a specific IP you choose, usually the origin's address instead of the edge's:
This says "for example.com on port 443, connect to 104.20.23.154 instead of whatever DNS says." Run it once against the edge IP and once against the origin IP and compare:
If the edge fails but the origin answers cleanly, the problem is the proxy or its config, not your app.
If the origin also fails the same way, the proxy was telling the truth, and the bug is in your origin app, the next and last layer.
This one trick, bypassing the proxy to test the origin alone, is what turns "the proxy returned a 502" from a dead end into a clear next step.
Layer 5 — Origin app: does your code return the right answer?
If you've eliminated DNS, TCP, TLS, and the proxy, the request reached your application and the bug is in your code or its dependencies. Now curl talks straight to the origin and you read the real status and body:
A 500 here is your app throwing an unhandled exception, go read its logs. A 504 confirmed at the origin usually means a slow database query or a hung external call. And this is where two logs together tell the whole story, which ties back to the observability chapter: match the timestamp on the proxy log (what it decided to return to the client) against the backend log (what your app was actually doing at that exact second). A crash in the backend log at the same moment as a 502 in the proxy log is an open-and-shut case.
Walking one real bug: "it works for me, not for them"
Checklists are easier to trust once you've watched one catch a real bug. Here's a classic. You ship a change that moves your site to a new server. You test it, the site loads, you call it done. An hour later, support is flooded: half your users can't reach the site, the other half are fine. It "works for you." Where do you even start?
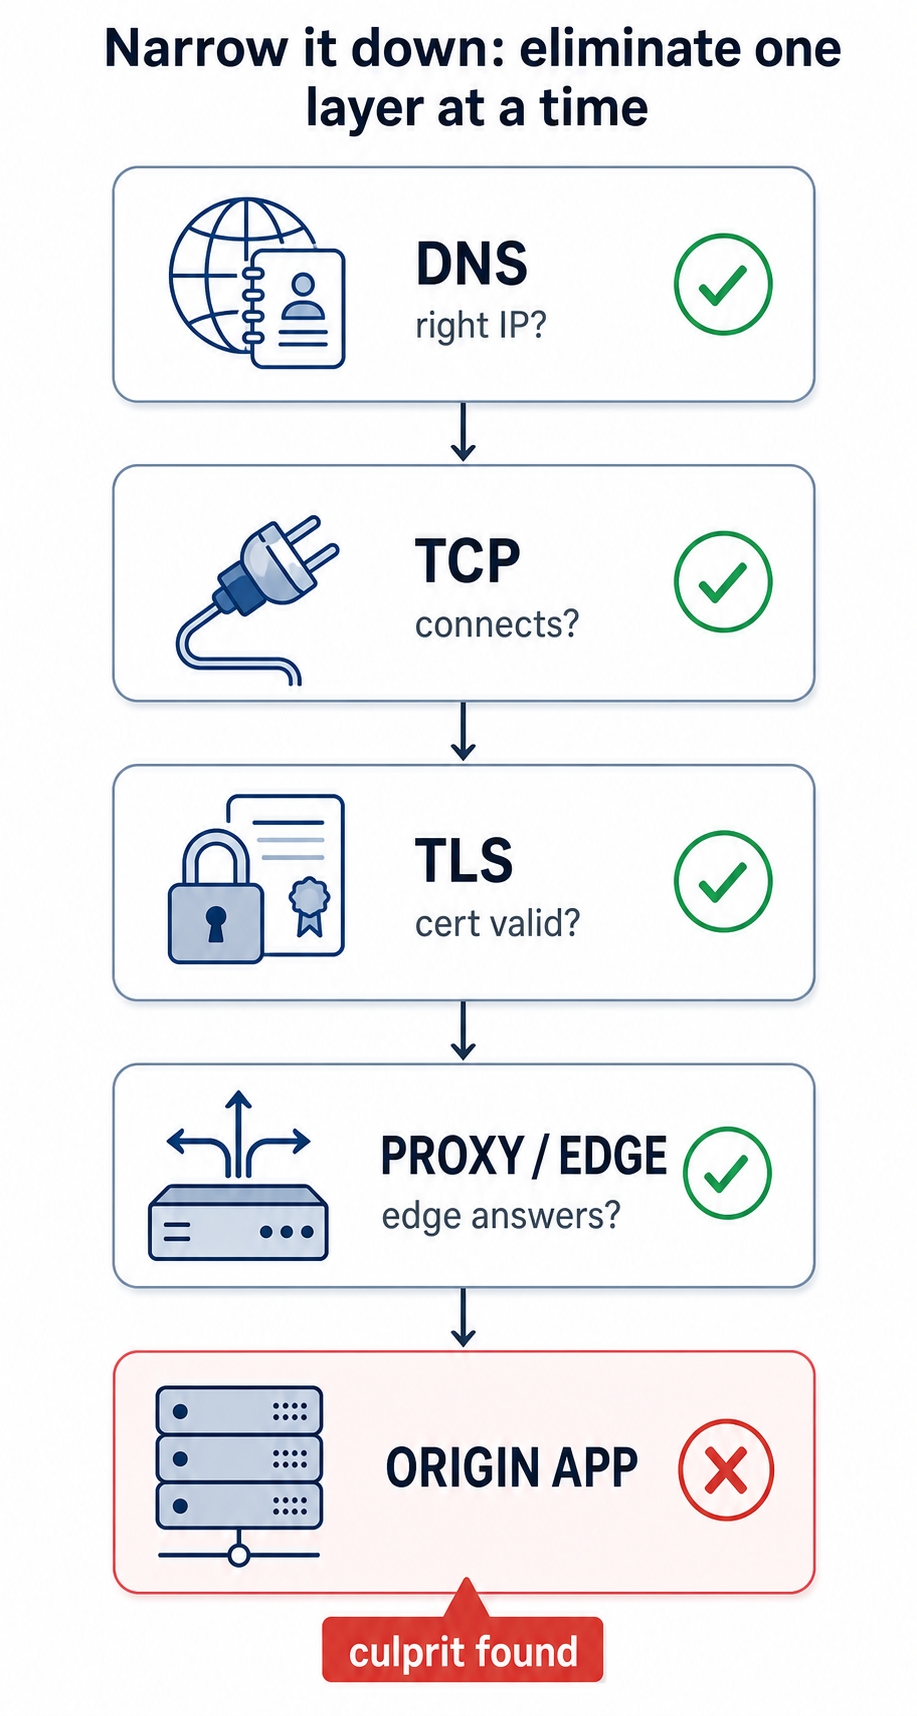
You start at the bottom and work up. The figure below is the shape of what you're doing: confirm each layer is fine and cross it off, until one layer fails and that's your answer.
Eliminate each layer in order until the failing one is found
DNS. First question: are you and the broken users even getting the same IP? You run dig example.com +short and get the new server's address. Good for you. But that's your resolver's answer, possibly from your own cache. The tell-tale of this bug is that the answer differs by who's asking. You query a public resolver that isn't your local one to get a second opinion:
dig @1.1.1.1 example.com +short
bash
It still returns the old server's IP. There it is. Your DNS change hasn't propagated everywhere yet. Users whose resolvers cached the old record are being sent to the old server, which may be off or serving stale content. Your machine had the new record, which is why it worked for you. The bug is DNS propagation, and you've found it at the very first rung, without touching the app, the certificate, or the proxy.
Notice what didn't happen: you didn't redeploy, you didn't restart anything, you didn't stare at application logs that would have shown nothing wrong. Because you worked the layers in order, the first NO stopped you exactly where the problem lived. Had DNS checked out clean on both resolvers, you'd have moved down: curl -w to confirm the connection opens, openssl s_client to check the certificate, curl --resolve to test the origin past the proxy, and finally the origin's own response. Same method, every time, whatever the bug turns out to be.
Your request-path debugging runbook
Keep this. It's the whole chapter, and most of the course, compressed into a sequence you can run on autopilot the next time something breaks.
Resist the urge to guess. Don't change anything yet. Reproduce the failure first.
DNS — does the name resolve to the right IP?dig name +short. Compare against a second resolver (dig @1.1.1.1 name +short) when "works for me, not for them." Wrong or stale IP → DNS is the bug.
TCP — does the connection open?curl -w and read time_connect. Never completes → server down, closed port, or firewall.
TLS — is the certificate valid and trusted?openssl s_client -connect host:443 -servername host. Check the subject, the NotAfter date, and Verify return code: 0 (ok).
Proxy / edge — is it the front door or the origin?curl --resolve host:443:ORIGIN_IP to bypass the proxy and hit the origin directly. Edge fails but origin is clean → proxy problem. Both fail → keep going.
Origin app — does your code answer correctly?curl -i straight to the origin, read the status and body, then match the proxy log against the backend log by timestamp.
Confirm the fix the same way you found it. Re-run the command at the layer that failed and watch it go green before you call it done.
The order is the whole point. Each step eliminates one layer, so by the time you reach the bottom you're not guessing anymore, you're looking exactly where the request actually died.
Try it now
Run the full sequence against a real site, top to bottom, even though nothing is broken. The goal is to get the four commands into your fingers so they're automatic when something is broken. Open a terminal:
Read each one against its layer: the IP from dig, the cumulative milestones from curl -w, the certificate chain and verify code from openssl, and from the last command, what happens when you point the connection somewhere else. (That final --resolve aims example.com at an address that isn't its real server, so notice how the request behaves when the layers stop lining up.) Once running this ladder feels routine on a healthy site, you'll reach for it without thinking the next time a page just spins.
What's Next
That's the last piece of the toolkit: a method that works the layers in order instead of guessing. The final chapter recaps the whole journey from a single wire to production HTTP and points you to where to go next.