Your server has 8 CPUs. The dashboard says CPU usage is 40%. But some requests are randomly slow. If you have seen this and wondered why, the OS scheduler is usually the reason.
The scheduler is the part of the operating system that decides which thread runs on a CPU core right now, and which threads have to wait.
Here is the situation that trips people up.
You run a web service on an 8-core box. A background job starts. It might be building a report, resizing images, or running a big loop. Right away, your slowest requests get slower. But your monitoring still shows spare CPU. So how can requests be slow if the CPU isn't full?
This happens because "CPU usage" is an average. It is usually measured over a few seconds, and averages hide the details. Your request does not care about the average over the last five seconds. It cares about the one millisecond when it needed a core. If a core was busy at that exact moment, the request waited.
Stretched over five seconds, the box looks half-idle. Up close, your request sat in line for 20ms before it got to run. Both things are true at once.
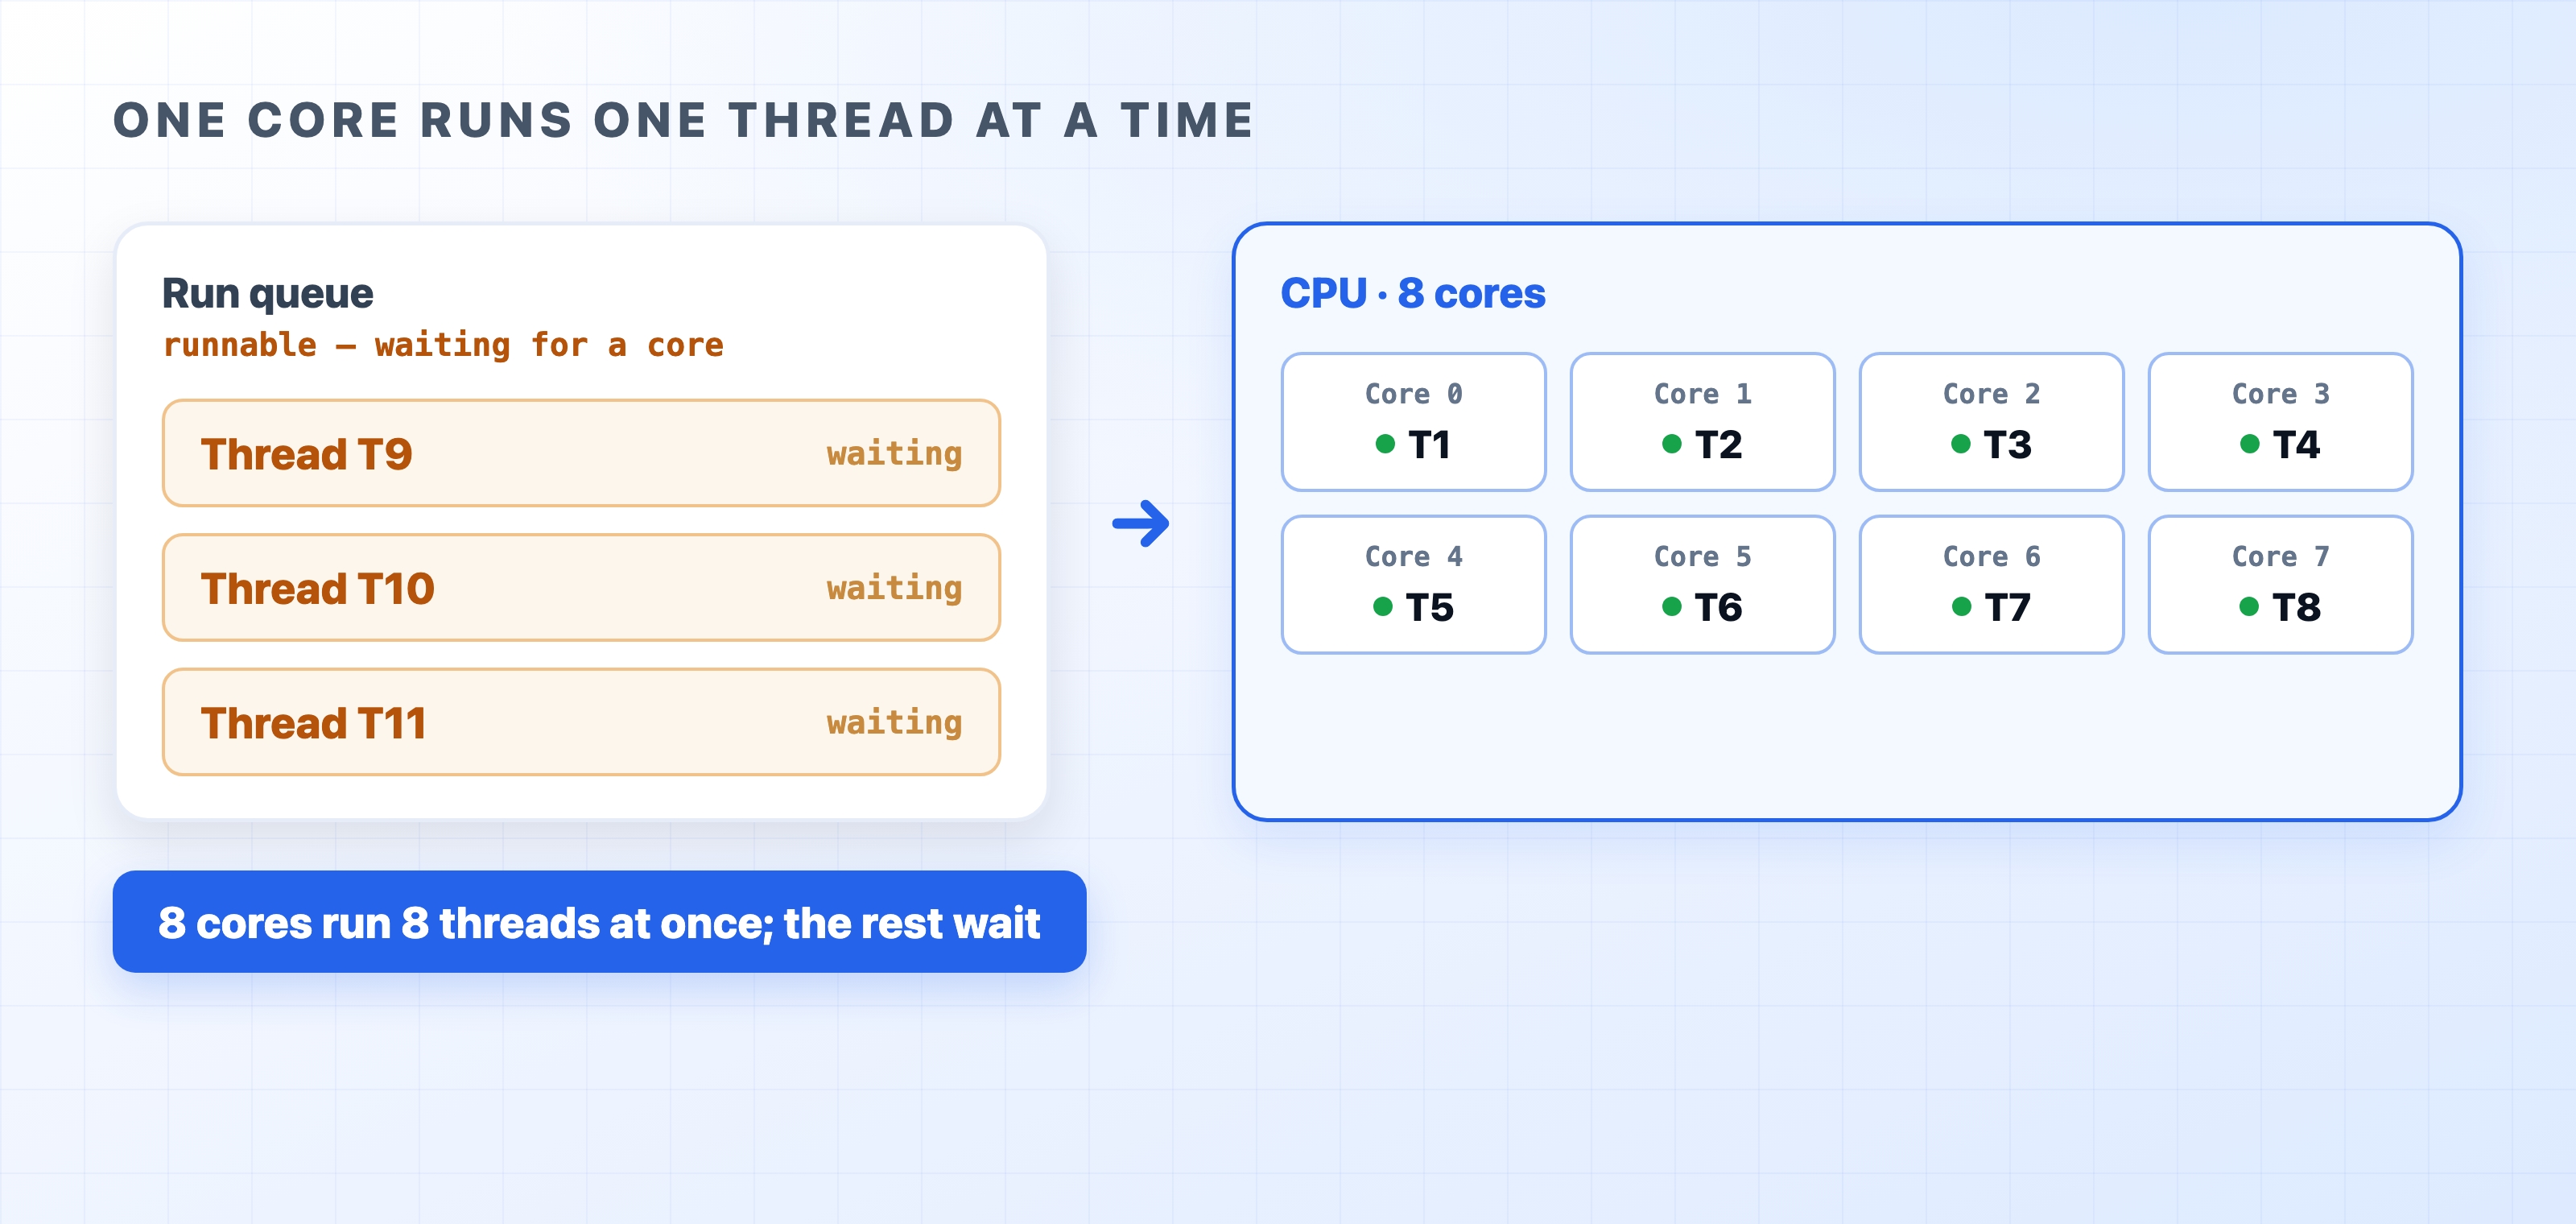
A CPU core runs one thread at a time. Everything else follows from this rule.
If more threads want to run than you have cores, some wait. Choosing who runs and who waits is the scheduler's job.
At any moment, a thread is in one of two states:
Runnable threads that cannot get a core right away go into the run queue. This is a line of threads waiting their turn. When you have more runnable threads than cores, the queue grows and work waits. This is also what "load average" measures. It roughly tracks how many threads are running or waiting to run. A load average above your core count means threads are queuing.
Now the earlier problem makes sense.
Your background job is CPU-hungry and stays runnable almost all the time. Every time your web request becomes runnable, it might find every core busy with that job. So it waits in the run queue for a time slice.
Each wait is small, maybe just a few milliseconds. But a single request touches the CPU many times. It has to parse the input, run your logic, and serialize the response. Each step can wait. Add them up and you get the latency spikes on your dashboard, even while average CPU usage looks calm.
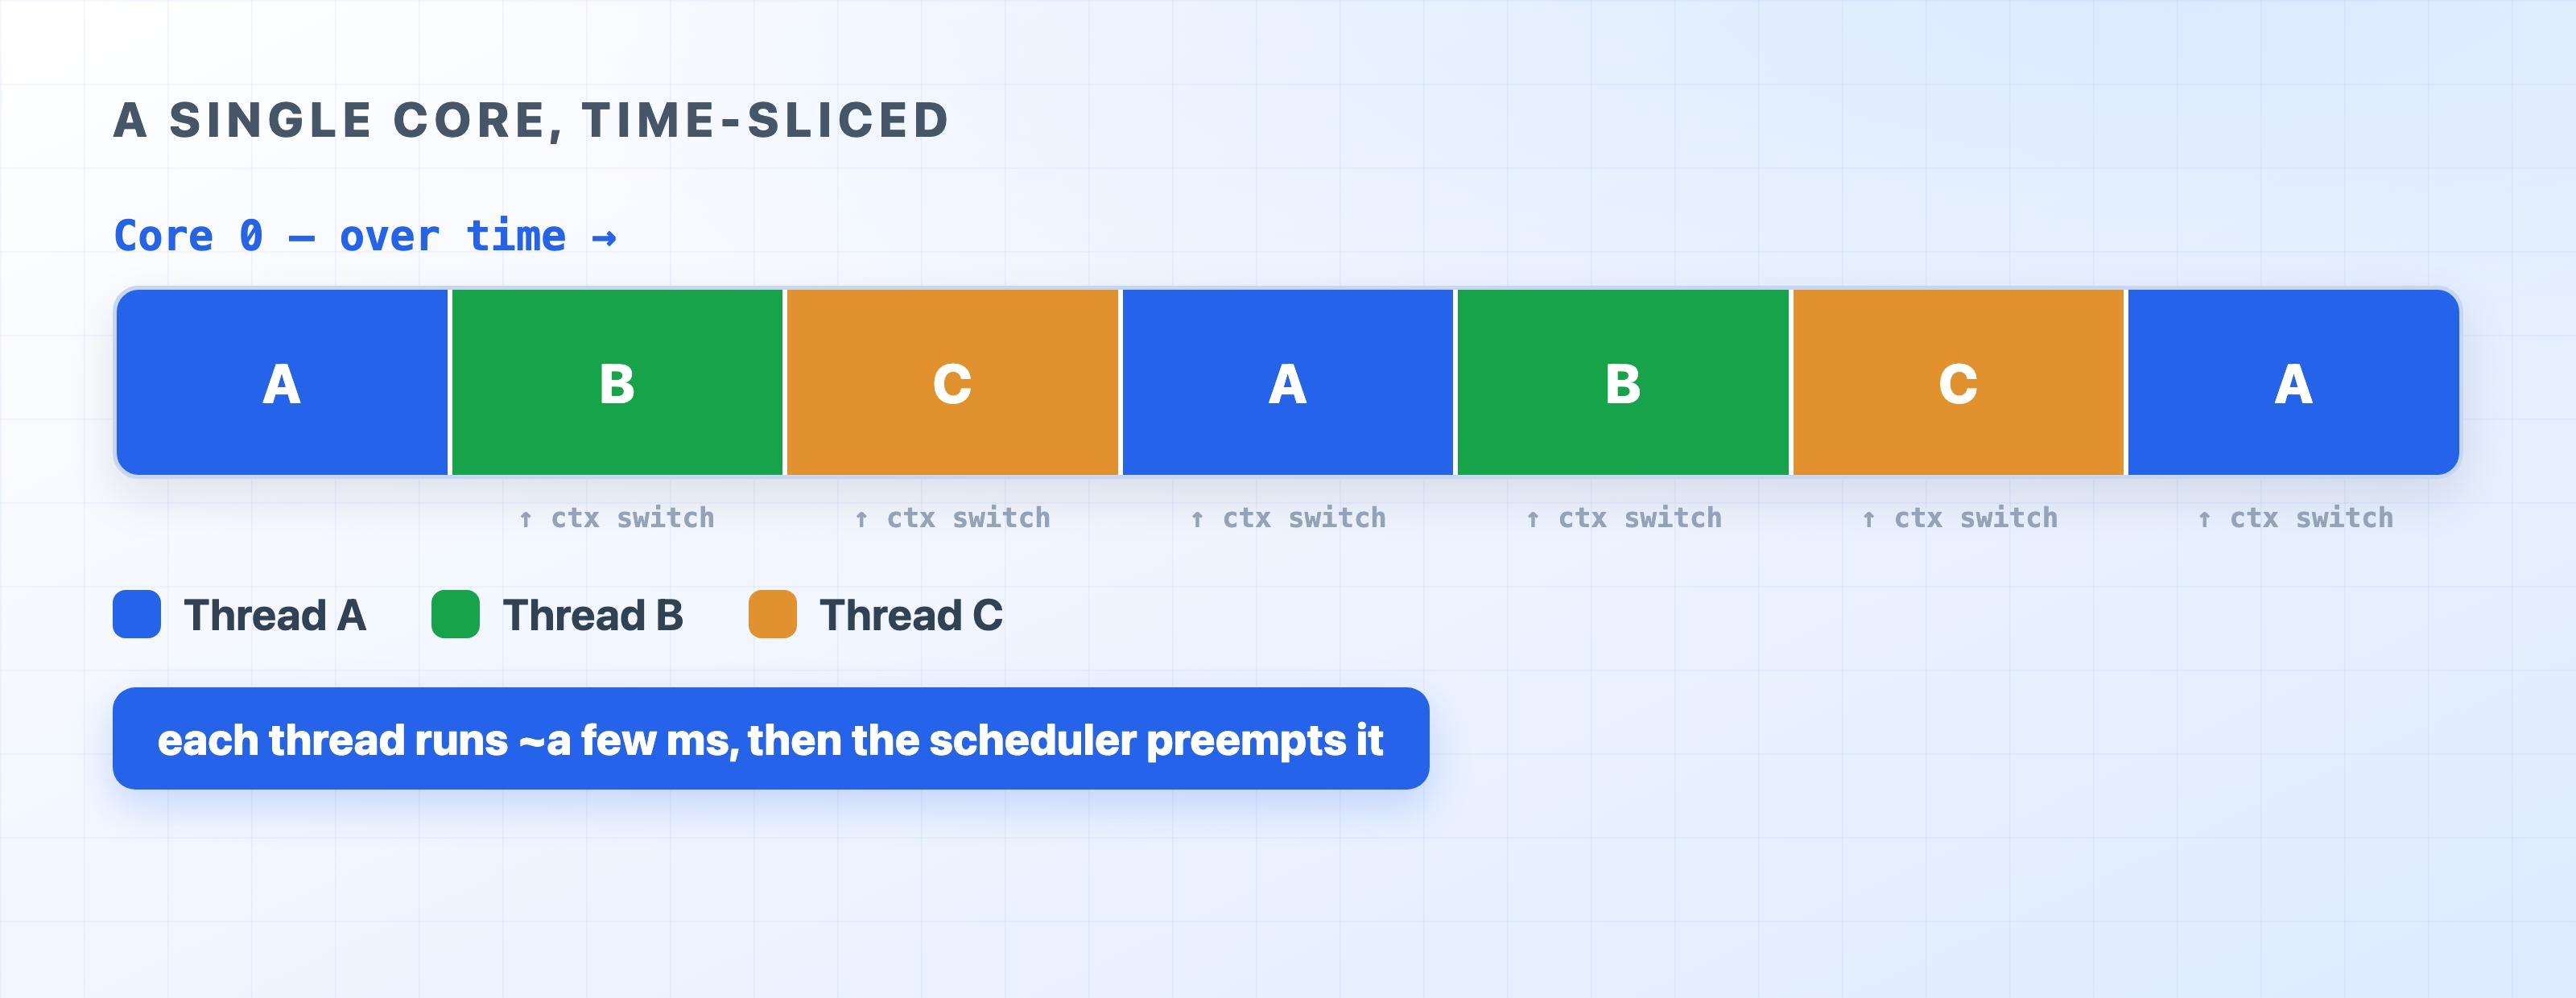
Since one core runs one thread at a time, the scheduler gives each runnable thread a small slice of time. Then it pauses the thread and switches to the next one. This is a context switch. If the scheduler does this fast enough, it looks like everything runs at once. In reality, the core is taking turns.

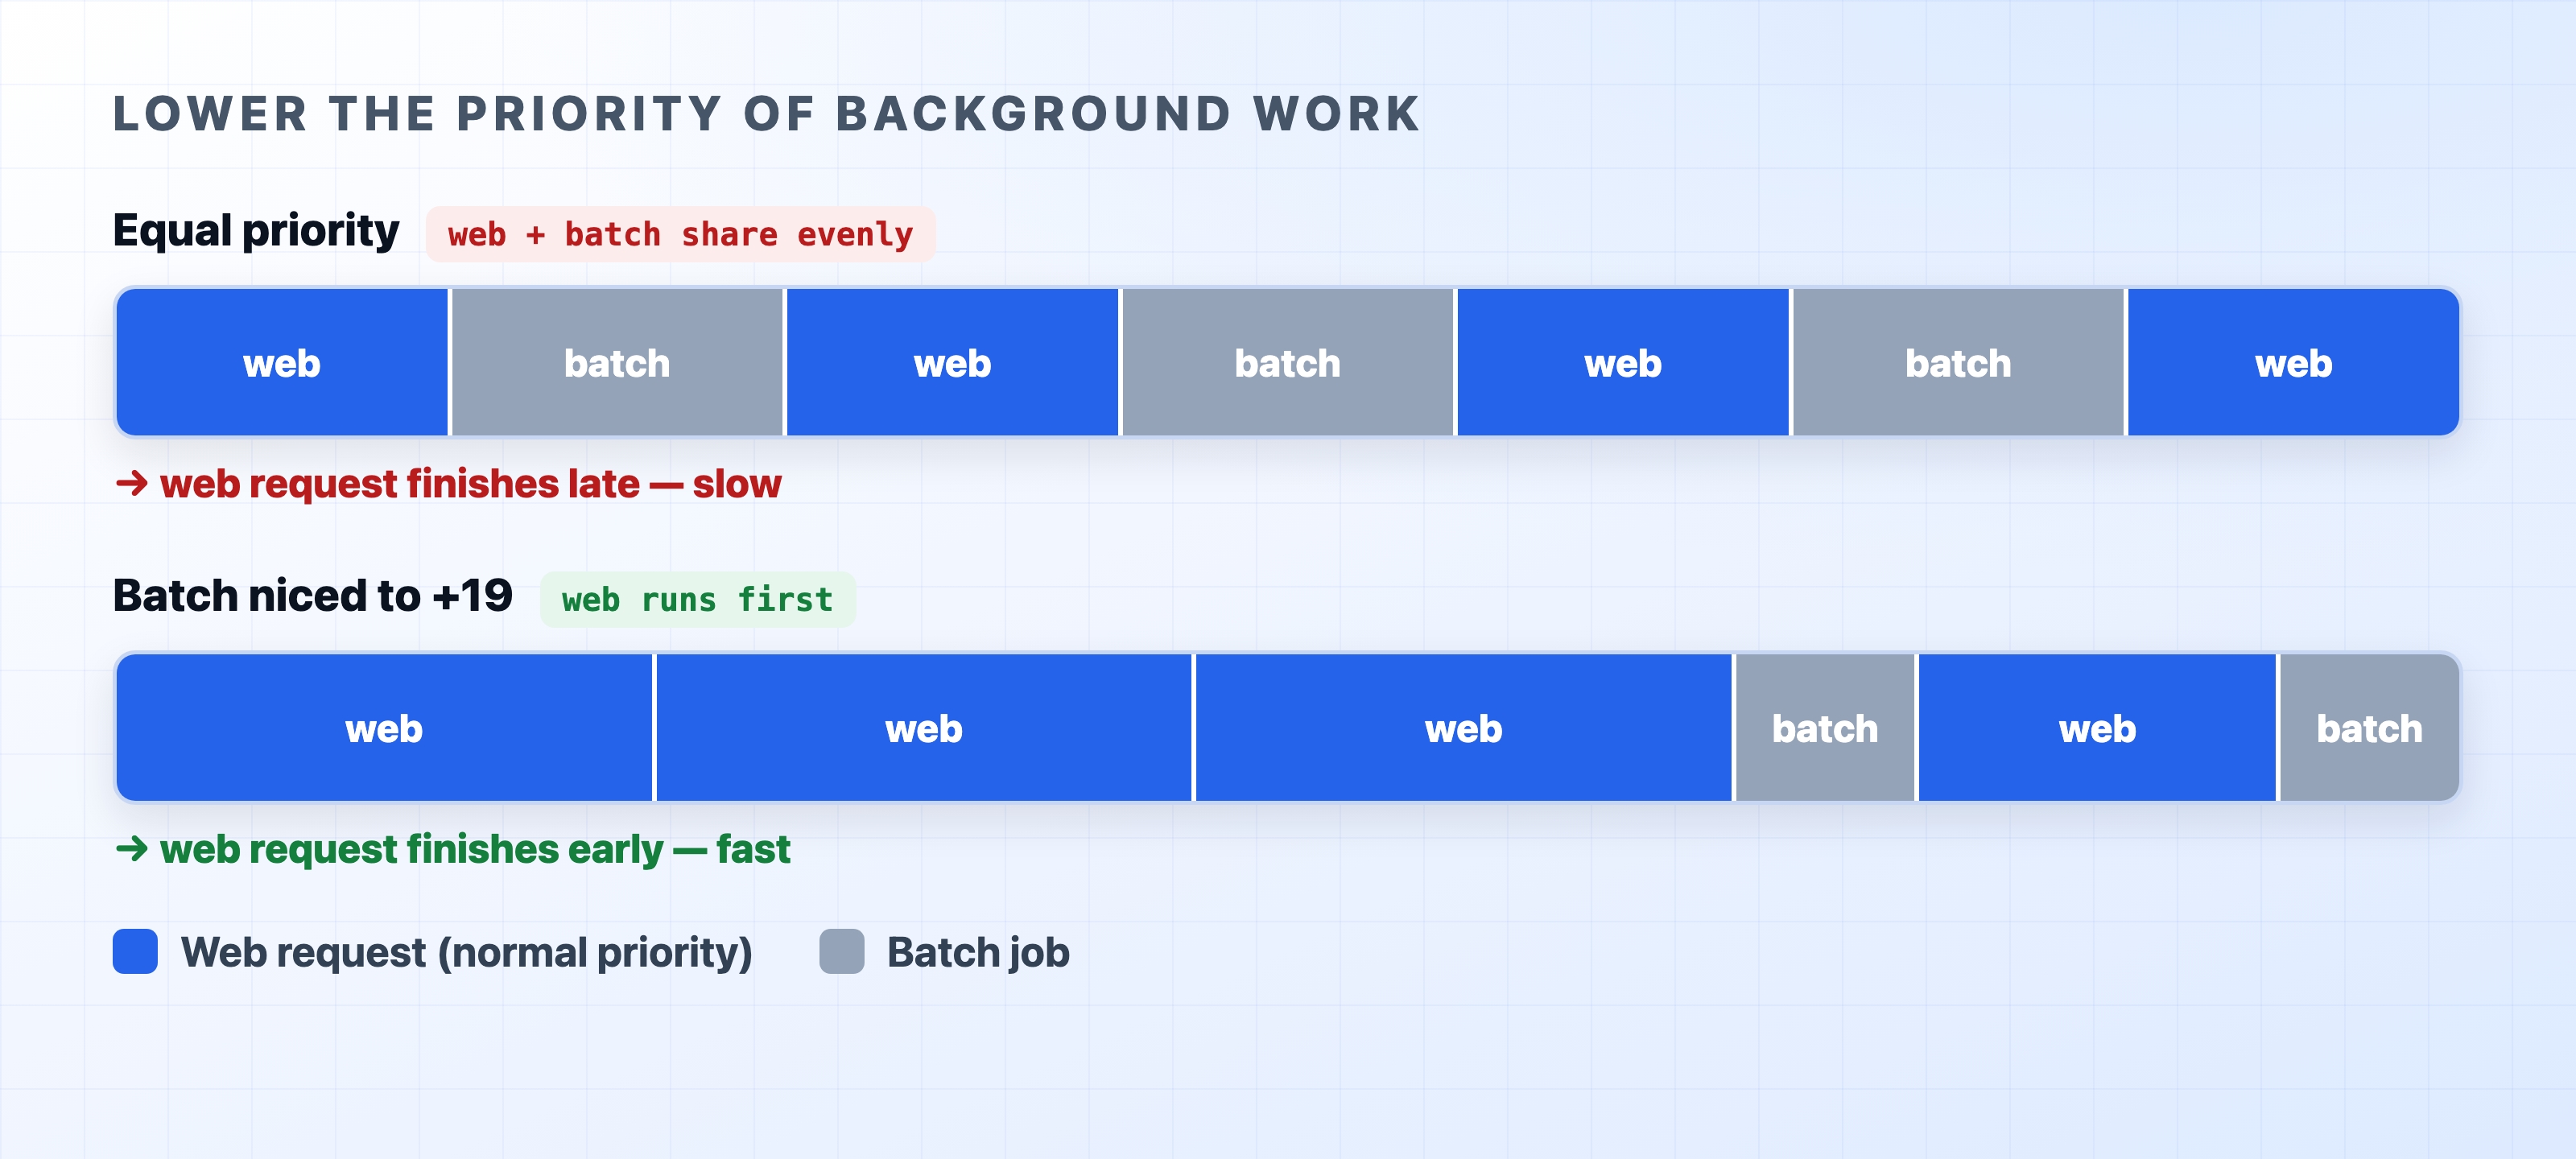
Threads do not all have to be treated equally. You can tell the scheduler that some work is less important. This makes it step aside when something more important wants to run. On Linux, this is the nice value. A higher number means lower priority:
bash# Start a job at low prioritynice -n 19 ./generate-reports.sh# Drop the priority of a job that's already running (by PID)renice -n 19 -p 4242
This is the direct fix for the situation above. Mark the background job as low priority. When it competes with a web request for a core, the request wins and the job waits. The job takes a little longer to finish, but your users do not notice. This is exactly the trade you want.

The same idea works in reverse for your own service. Keep the number of runnable threads near your core count so the run queue stays short. For a Node.js app, that means one worker process per core with the cluster module. You want to avoid hundreds of threads fighting over the same cores.
Stop reading CPU usage as one number. Start thinking in terms of runnable threads and a run queue.
CPU usage tells you how busy the cores were on average. It does not tell you whether your work waited to get on a core. Latency lives in that wait. Once you think about the queue instead of the percentage, the confusing cases make sense. A load average past your core count is just a long queue. A background job hurting your API is just competition for cores. A container throttled with "idle" cores is just its CPU quota running out mid-slice.
The scheduler is not misbehaving in any of these situations. It is doing its job. It shares a fixed set of cores among more threads than fit at once. One reminder when you chase tail latency: the scheduler is not the only source of pauses. A stop-the-world garbage collection pause can stall a request the exact same way a full run queue can.
Why opening a database connection per request is slow, what a connection pool does, how to use one correctly in Node.js, and how to size it.
How V8 manages memory in Node.js: the heap, generational GC, Scavenge vs Mark-Sweep-Compact, GC pauses, leaks, and when to tune.
What test coverage actually measures in Node.js, and how to pick a threshold that catches bugs without chasing 100%.