You never call free() in JavaScript. You create objects, pass them around, and the V8 engine reclaims the memory automatically once nothing references them anymore. This post is a tour of how Node.js garbage collection works: where your objects live, the two collectors V8 runs, why a collection can spike your tail latency, and how to watch the whole thing happen.
V8 memory model with stack and heap regions
That convenience hides a complex system, and when it struggles you see it: latency spikes, memory that only climbs, and the occasional JavaScript heap out of memory crash. Most developers never look under the hood until production forces them to.
This post covers enough of V8's memory model to reason about what your process is doing, spot the leaks the collector cannot fix for you, and know which settings to change and when to leave them alone.
What These Terms Mean
Heap. This is the region of memory where V8 stores objects, arrays, closures, and strings. It holds anything whose size or lifetime is not fixed at compile time. When you write const user = { name: "Ada" }, that object lives on the heap. The garbage collector only manages the heap.
Generational GC. This is a collector that sorts objects by age and treats them differently. It relies on the generational hypothesis: most objects die young. A request handler might allocate dozens of throwaway objects that become garbage microseconds later. Meanwhile, a configuration object loaded at boot lives for the entire process. V8 collects the young objects often and cheaply, and the old ones rarely.
Stop-the-world. This is a pause where V8 halts your JavaScript to run part of a memory collection. Nothing else executes during a stop-the-world phase. There is no request handling, no timers, and no I/O callbacks. Short pauses are invisible to users, but long ones show up as tail latency.
The V8 memory model
Your program uses two kinds of memory. The garbage collector only cares about one of them.
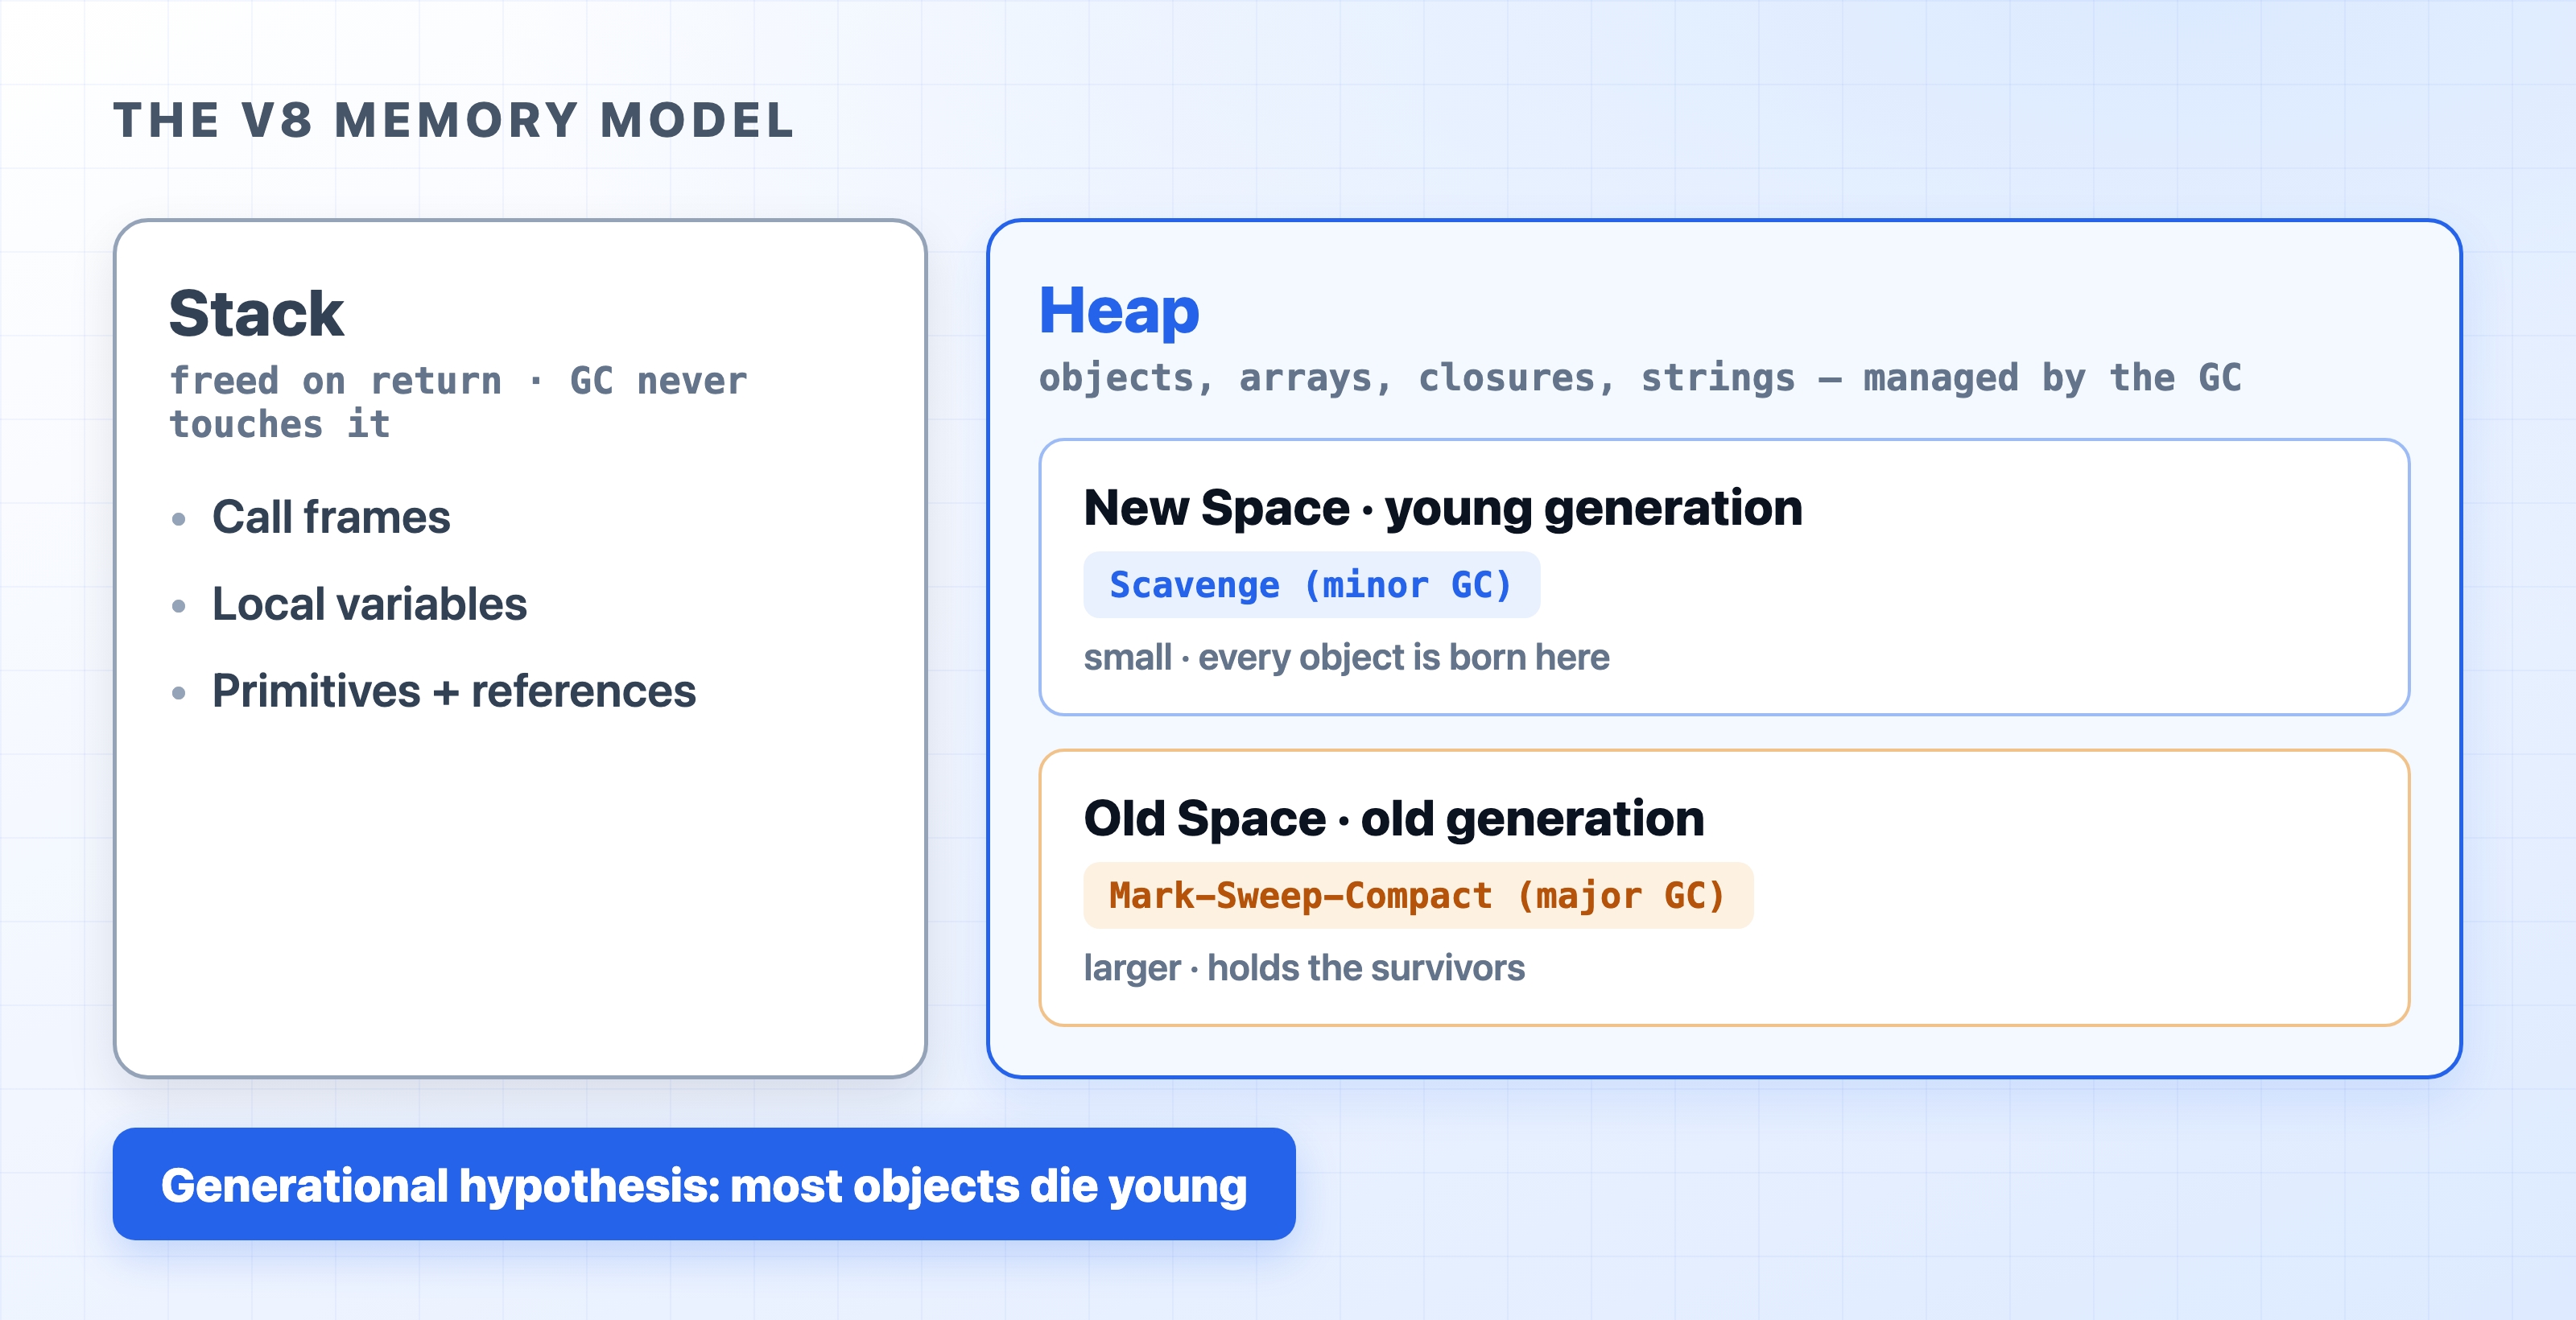
The stack holds one frame per function call. This frame contains local variables, arguments, and bookkeeping data. Primitives and references sit here, and the frame is popped automatically the moment the function returns. The stack is fast and self-cleaning. The garbage collector never touches it.
The heap is everything else. Any object, array, function, or string with a lifetime the compiler cannot predict is allocated on the heap. This is what the garbage collector manages. V8 divides the heap into several spaces, but two of them tell the main story:
New space (the young generation) is small, usually on the order of tens of megabytes. Every object is born here. It is collected by a fast, frequent collector called Scavenge.
Old space (the old generation) is much larger. It holds objects that have already survived a collection or two. It is collected by the slower Mark-Sweep-Compact collector.
The lead figure above shows this layout: the stack on one side, the heap split into new and old space on the other. The split exists because of the generational hypothesis. If most objects die young, most of your garbage is in new space, so it pays to collect new space constantly and cheaply while barely touching old space. Nearly every design decision below follows from that.
Scavenge: collecting the young generation
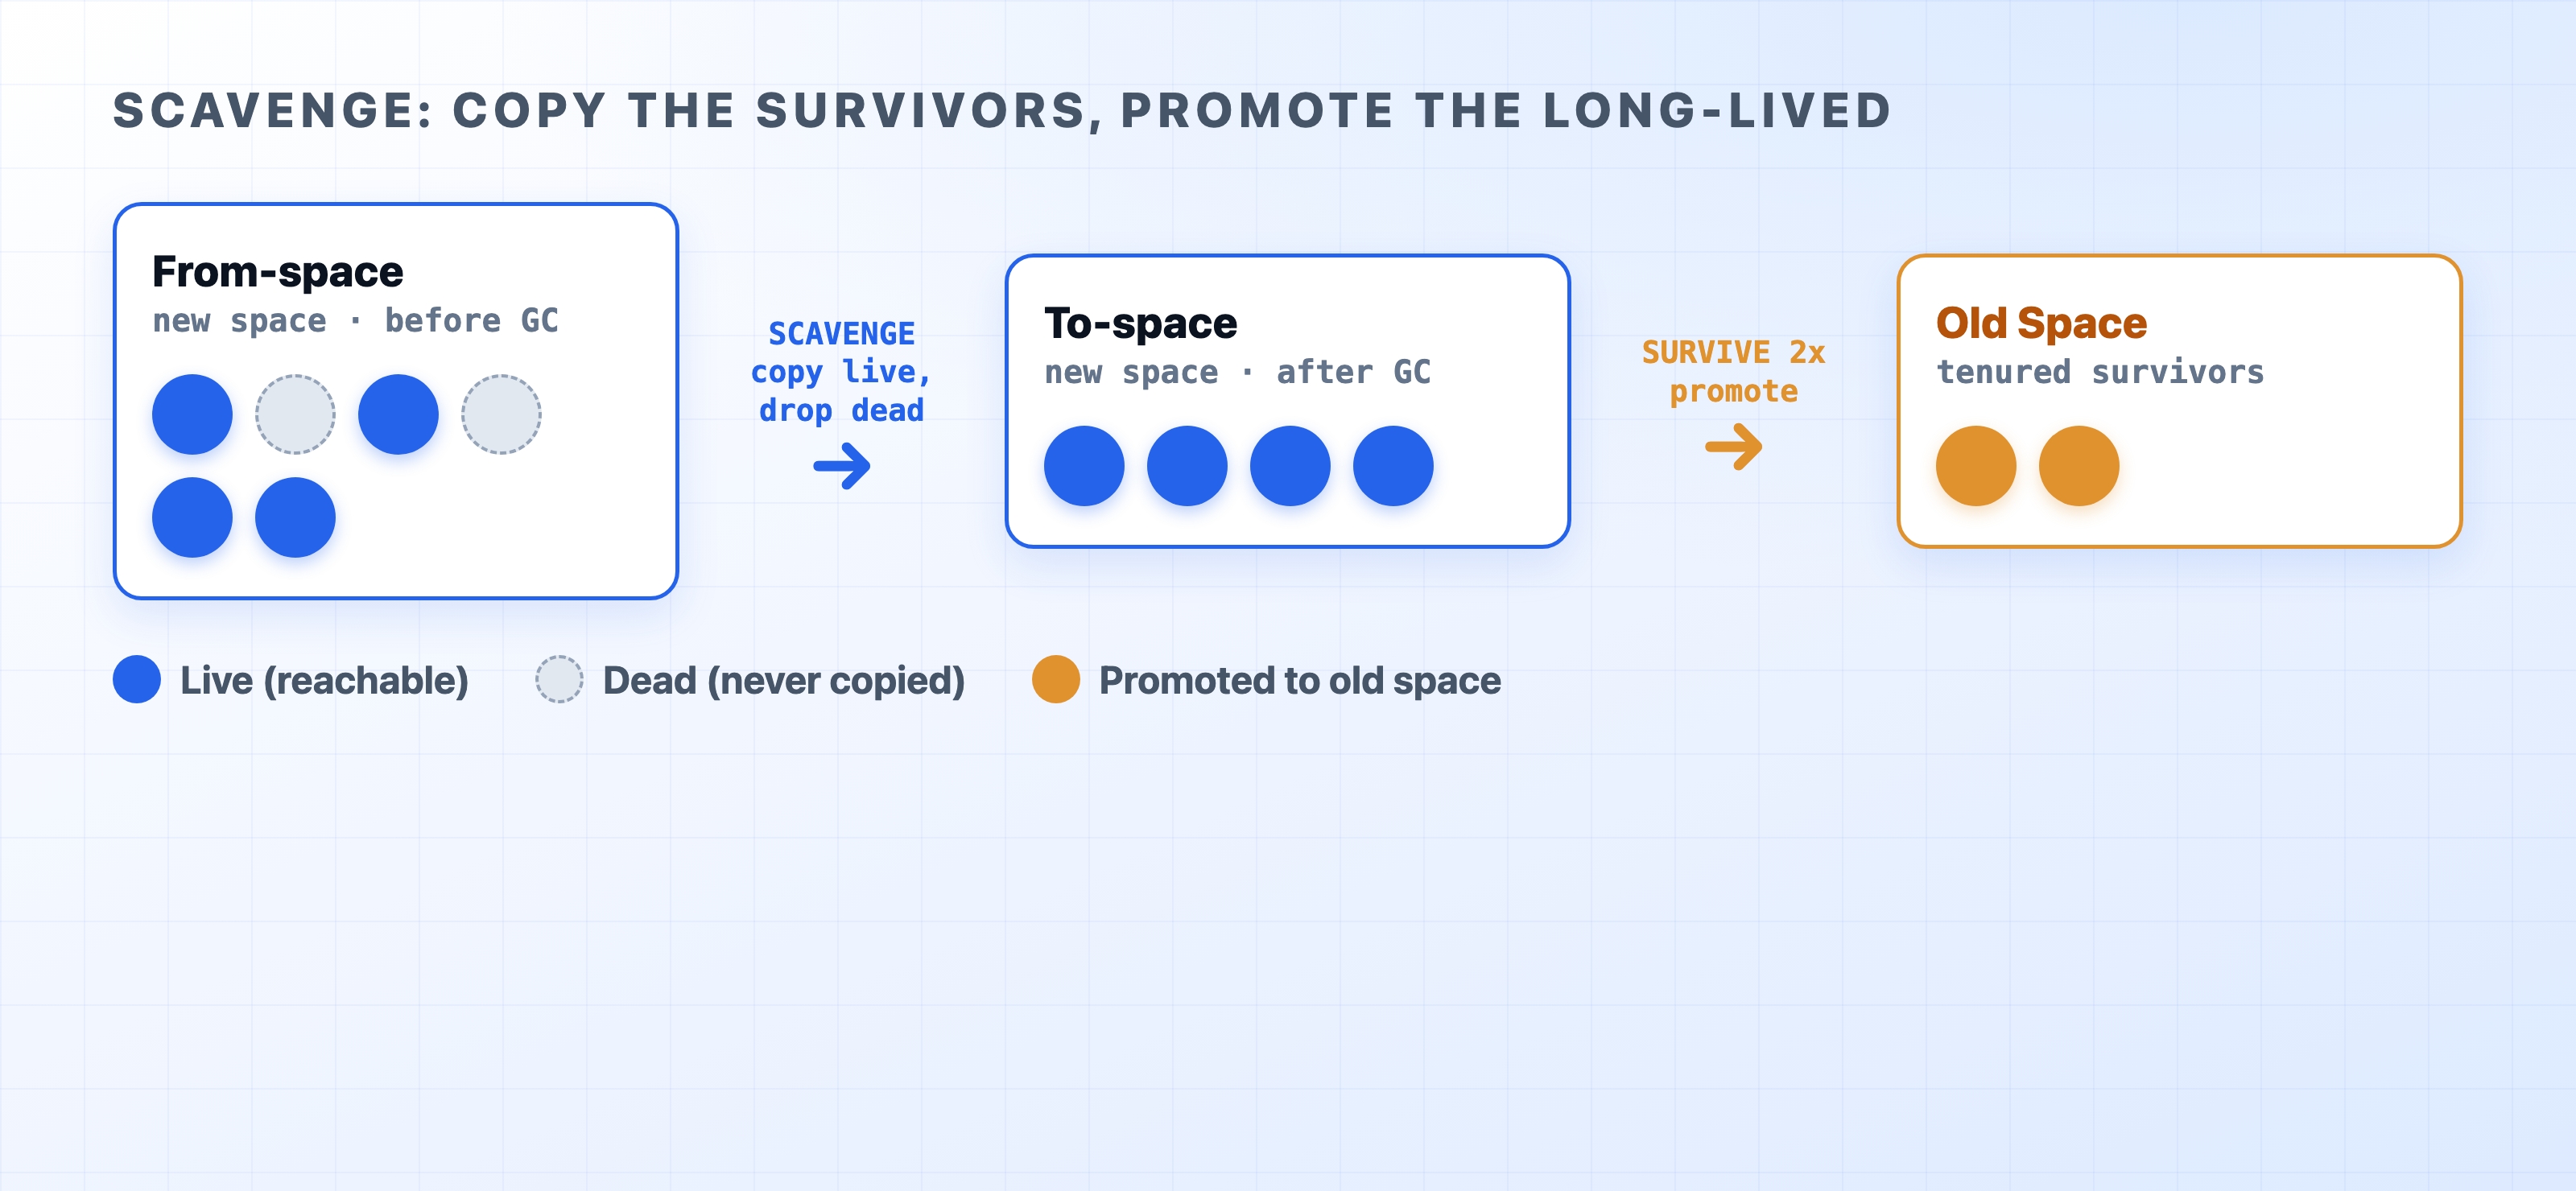
New space is managed by a copying collector, conceptually based on Cheney's algorithm. V8 splits new space into two equal halves: a From-space and a To-space. Only one half is active at a time. New objects are allocated into From-space by simply bumping a pointer forward. This is about as cheap as memory allocation gets.
When From-space fills up, a minor garbage collection called a Scavenge runs. It walks through the live objects and copies each one over to To-space, packing them tightly together. Then, it swaps the roles of the two halves. The key to this process is what it skips: dead objects are never visited at all. The cost of a Scavenge is proportional to the number of survivors, not the amount of garbage. Because most objects die young, survivors are few. The collection is fast and usually takes well under a millisecond.
How Scavenge copies survivors and promotes them
An object that survives gets a second chance, and then it graduates. Once an object lives through about two Scavenges, V8 decides it is probably long-lived. V8 promotes (or tenures) the object into old space. There, it stops paying the frequent-collection tax. The figure above traces that path: allocate in From-space, copy to To-space if still reachable, and move up to old space after surviving a couple of rounds.
This is why allocation-heavy code can run fast in Node.js. Throwaway objects in a busy request handler almost never survive long enough to be copied. They simply evaporate when From-space is recycled. Scavenge runs often, but each run is short and cheap.
Mark-Sweep-Compact: collecting the old generation
Old space cannot use a copying collector. It is too large to keep a spare empty half lying around, and copying gigabytes of data on every collection would be too slow. Instead, old space gets a different, more thorough collection in three phases.
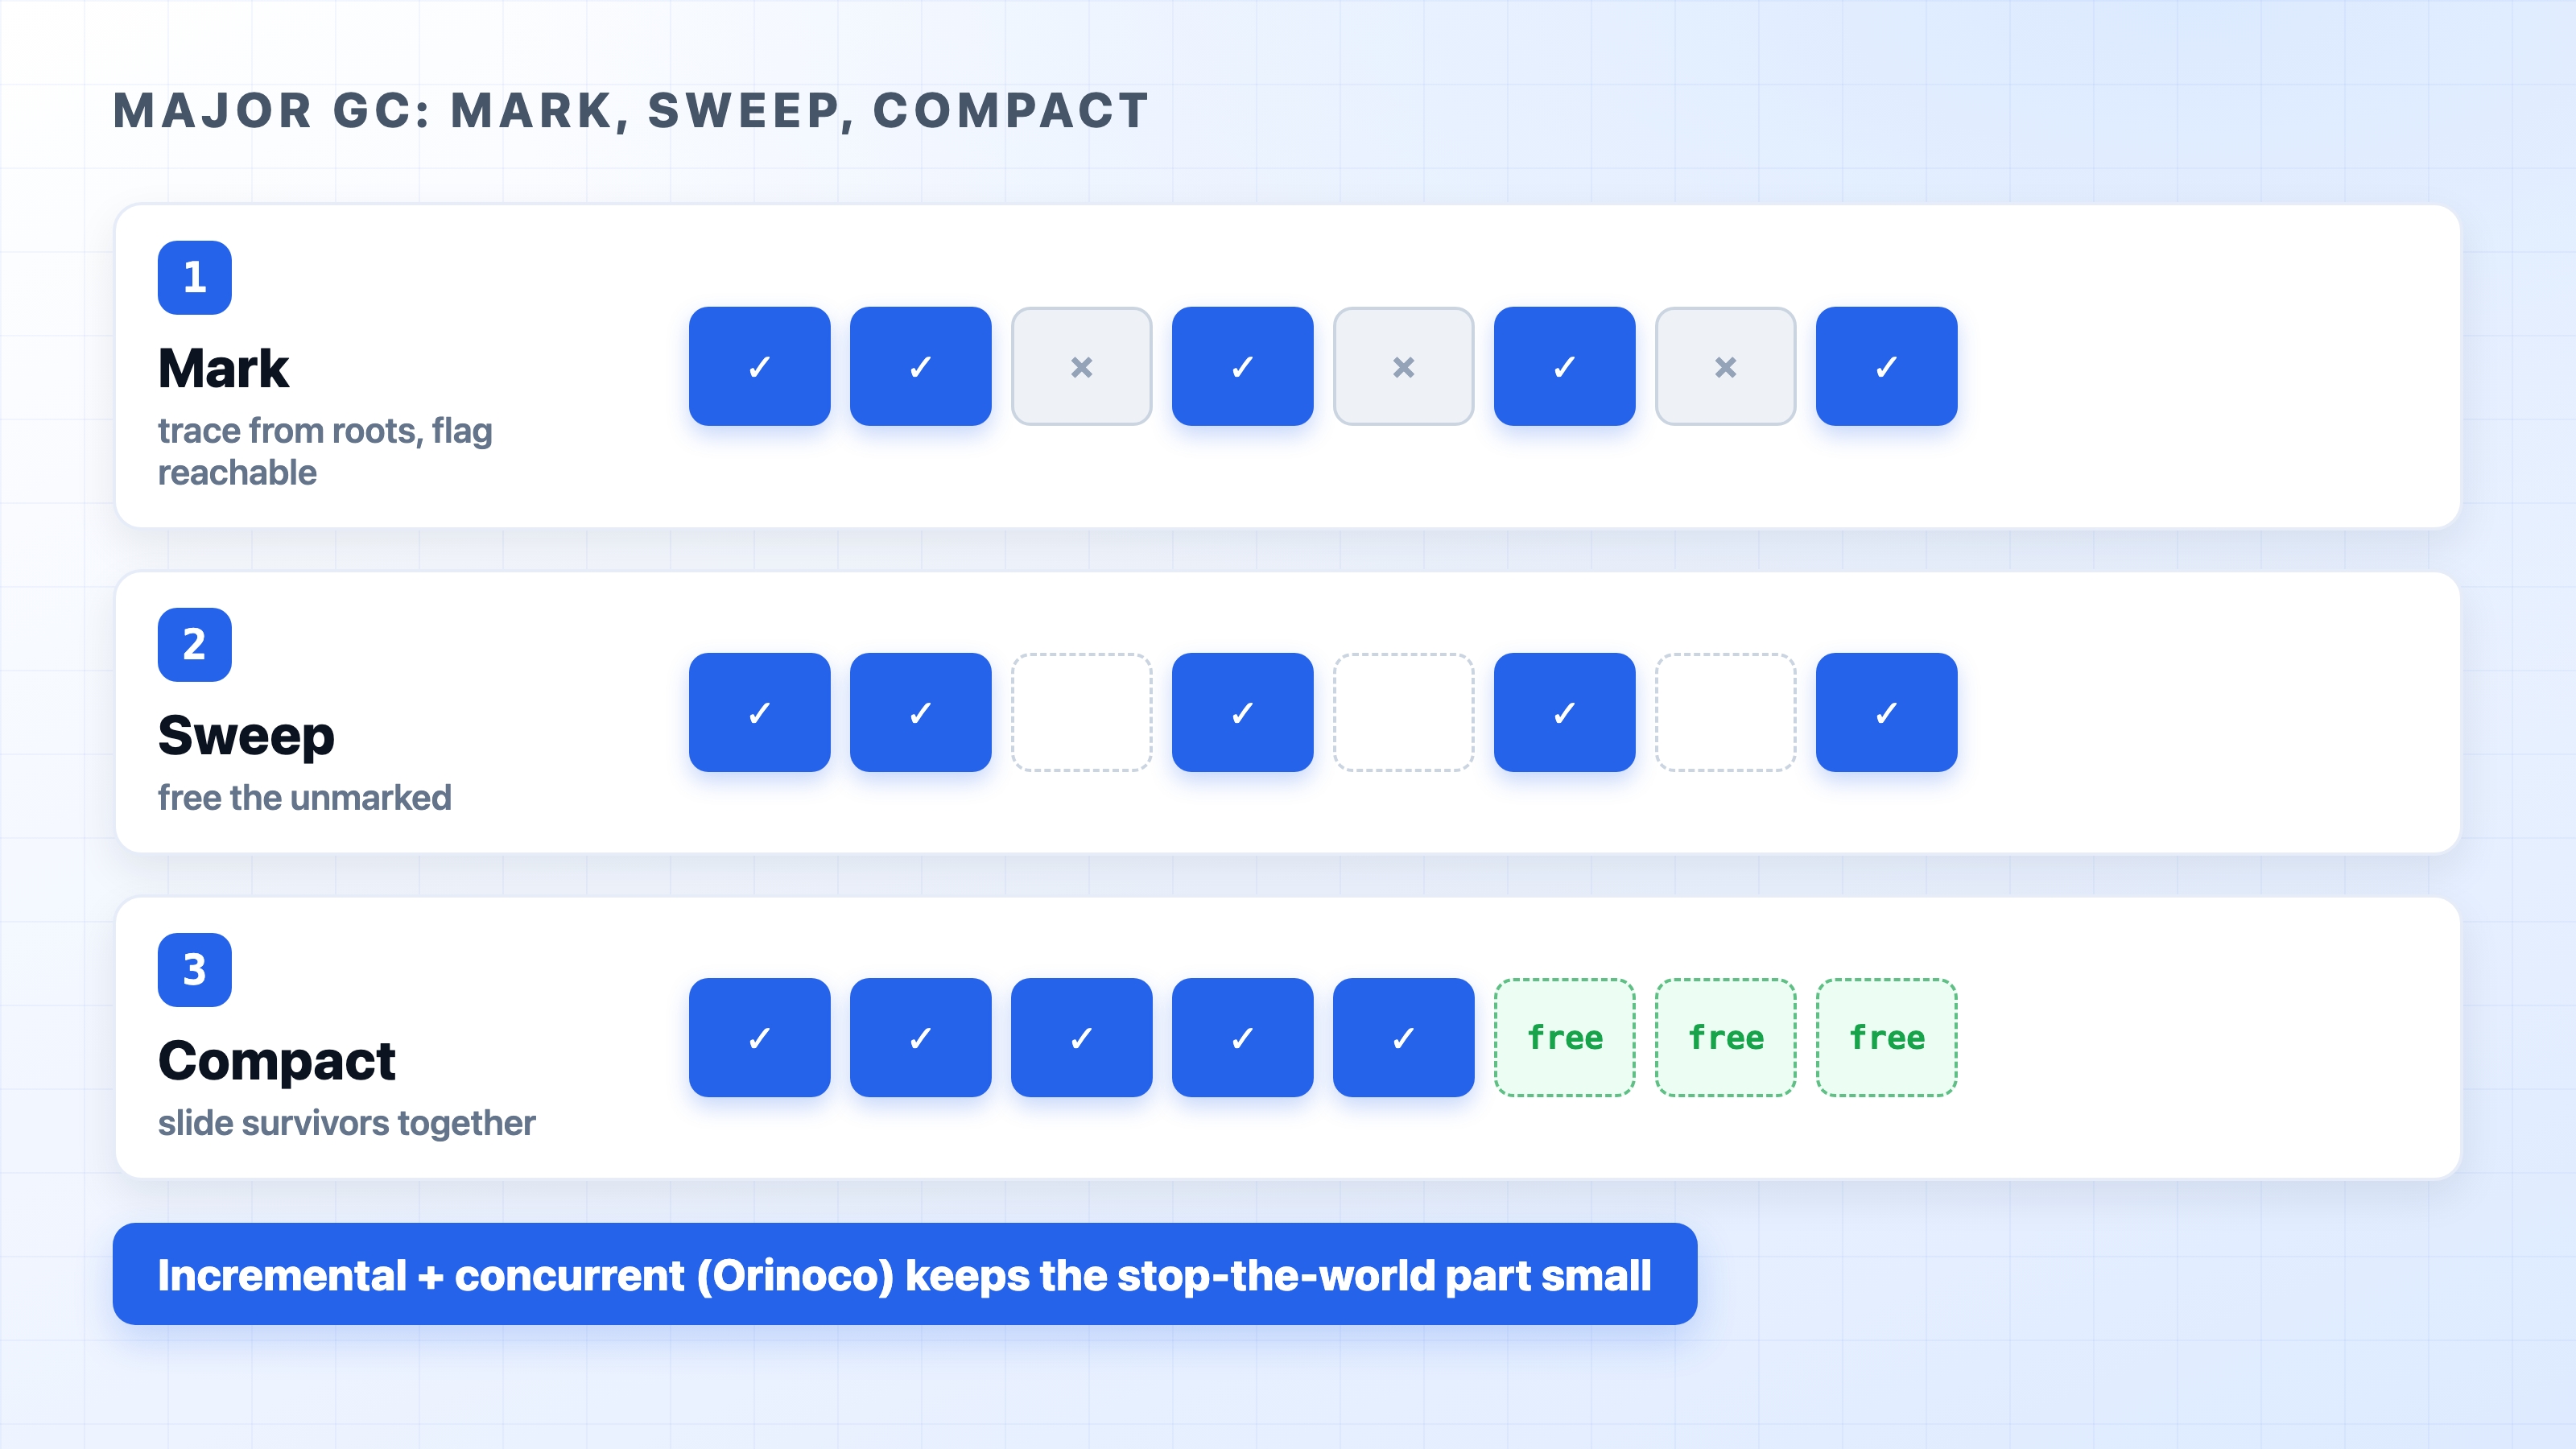
Mark starts from the roots. These include the global object, the current stack, and a few other entry points. The collector traces every reference it can reach and marks each reachable object as live. Anything it cannot reach is unreachable and therefore garbage.
Sweep walks the heap and reclaims the unmarked objects. It adds their memory slots to a free list so the allocator can reuse them. The live objects stay exactly where they are.
Compact runs when sweeping leaves old space fragmented, with live objects scattered between freed holes. It slides the survivors together so free memory forms one contiguous block again. Compaction is expensive, so V8 does not do it on every cycle. It only runs when fragmentation warrants it.
Major GC mark sweep and compact phases over old space
Done naively, a major collection is a single long stop-the-world pause over the entire old space. On a large heap, that can take tens of milliseconds. V8's modern collector, named Orinoco, exists to shrink that pause. It marks incrementally, doing the work in small slices interleaved with your JavaScript instead of one big stall. It marks and sweeps concurrently on background threads while your code keeps running. Finally, it parallelizes the unavoidable stop-the-world portions across helper threads. You still pay a performance cost for a major collection, but Orinoco keeps the actual application freeze as short as possible.
Why GC pauses hurt latency
A stop-the-world pause means your event loop is blocked. While V8 is in a synchronous collection slice, no request gets handled, no callback fires, and no timer runs. It is the same category of problem as running a synchronous JSON.parse on a huge payload. The loop simply is not free to do your work.
Scavenges are short enough that you rarely notice them. The major collections are where tail latency comes from. Even with Orinoco doing most of the marking off-thread, the final marking and any compaction still require stop-the-world slices. On a large old heap, those slices land on whatever requests happen to be in flight. Your median response time (p50) stays flat, but your p99 and p99.9 metrics spike because a handful of unlucky requests caught the pause. The bigger your live heap, the more there is to scan, and the worse those tail spikes get.
The metric that captures this is event-loop lag: how long a callback waits past its scheduled time. A collection pause shows up there directly, because a frozen loop cannot run the callback on time. Watch event-loop lag alongside your pause times to see whether GC is actually costing your users latency or is short enough to ignore.
This connects directly to how you scale Node.js. One process means one heap and one collector. A pause in that process stalls everything it serves. Running multiple workers with the cluster module gives each worker its own heap and independent collector. A major collection in one worker does not freeze the others. When climbing memory pushes you to recycle workers periodically, you want each one to leave the pool cleanly. This is exactly what graceful shutdown is for: drain in-flight requests, then exit, so reclaiming memory never costs you dropped traffic.
Common memory-leak patterns
Here is the problem the collector cannot help you with. A leak in a garbage-collected runtime is not memory the collector lost track of. It is memory that is still reachable from something alive, so the collector correctly refuses to free it. Find the reference that is keeping it pinned, and the leak goes away.
A few patterns cause almost all memory leaks in Node.js.
Unbounded caches. A module-level Map used as a cache, keyed by something with unlimited cardinality like user IDs, URLs, or request bodies. It grows with traffic and is never evicted. It looks harmless in code review but runs forever in production.
// leaky-cache.js
const cache =newMap();
exportfunctiongetProfile(userId, build){
if(!cache.has(userId)){
cache.set(userId,build(userId));
}
return cache.get(userId);
}
javascript
Closures that capture large scopes. A closure keeps every variable it closes over alive, even the ones it never reads. If you return a small callback that happens to close over a multi-megabyte buffer, and you store that callback somewhere long-lived, the buffer can never be collected.
Event-listener accumulation. Registering a listener on an EventEmitter in a hot path without ever removing it means the emitter accumulates references on every call. The MaxListenersExceededWarning in Node.js is an early hint that this is happening.
Dangling timers. A setInterval that is never cleared keeps its callback alive for the life of the process. It also keeps everything that callback references alive. The same goes for a setTimeout you forgot to cancel.
Globals. Anything hung off a global or a module-level variable lives until the process exits. That is fine for configuration data, but fatal for anything that accumulates per request.
Healthy sawtooth heap versus a leaking staircase heap
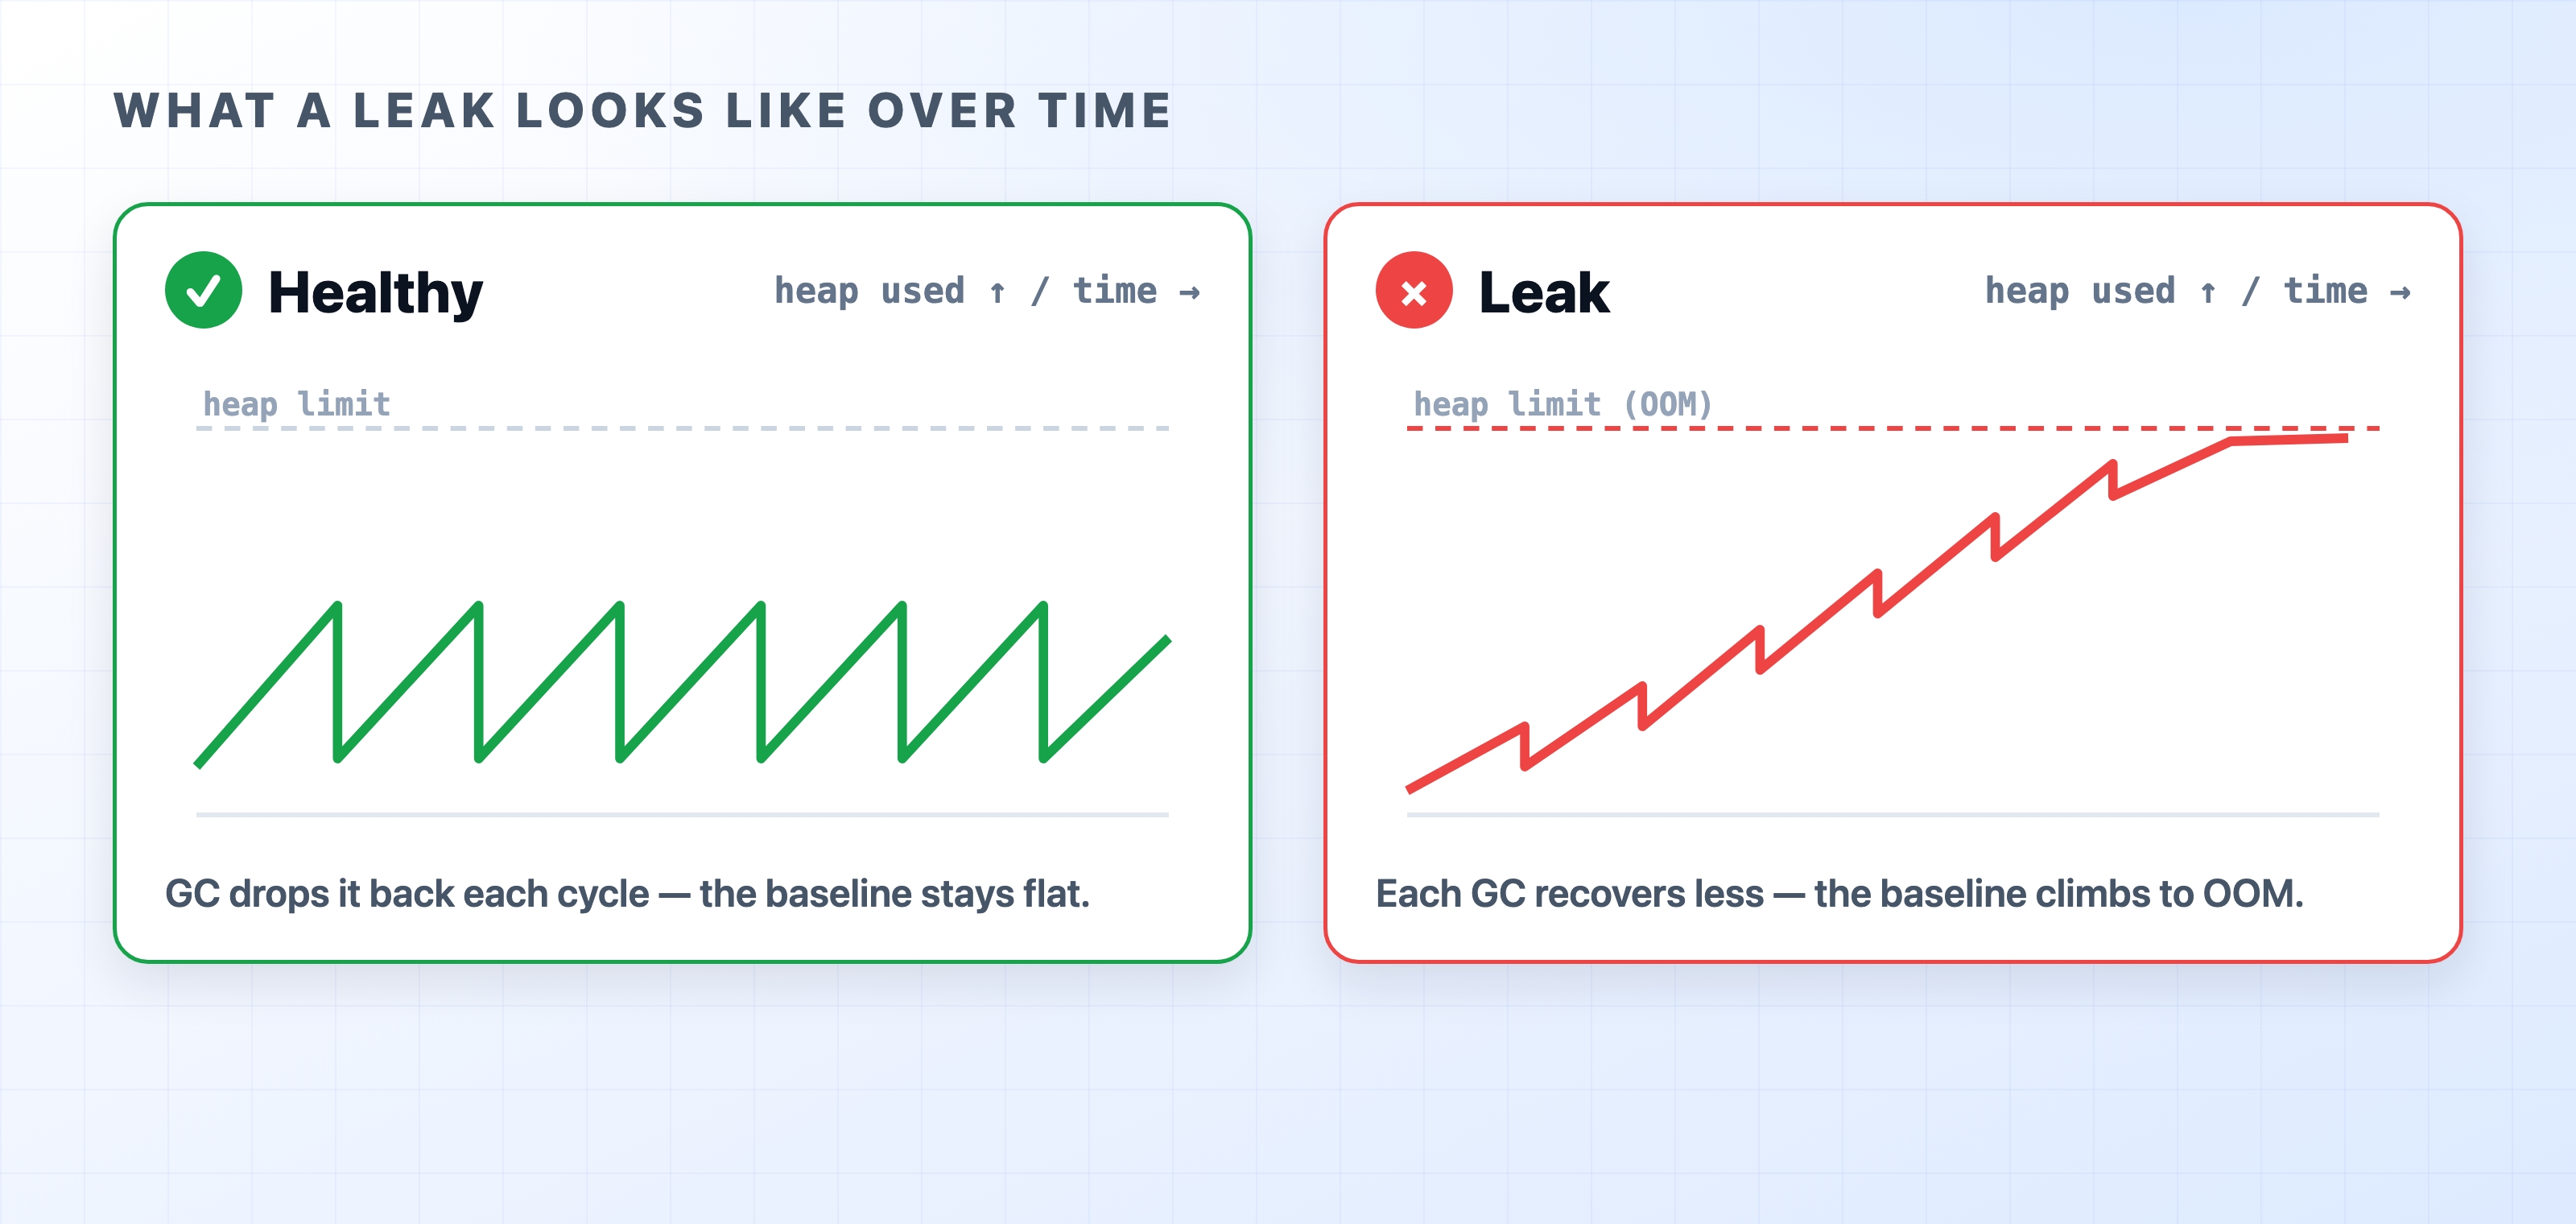
The figure above shows what a leak looks like over time. A healthy process produces a sawtooth pattern: heap usage climbs, a collection drops it back down, and the baseline stays flat. A leak produces a staircase pattern: each collection recovers a little less than the last, the baseline ratchets upward, and the line eventually crosses the heap limit until the process dies. If memory only ever goes up across collections, you have a leak. No amount of tuning will fix it.
When the lifetime of a cached value should track some other object rather than a size limit, reach for a WeakMap. A WeakMap holds its keys weakly. Once nothing else references a key object, the collector is free to drop that entry without any eviction logic required. It is the right tool for per-object metadata. It is the wrong tool when you key on strings or numbers, which are never weakly held.
The fix is almost always to bound the thing that grows. Cap the cache, remove the listener when you are done with it, and clear the timer on shutdown.
You do not have to guess what your memory is doing. V8 and Node.js expose several ways to watch collection happen, ranging from a simple command-line flag to a full retainer graph.
--trace-gc is the cheapest option. Start Node.js with this flag, and V8 prints one line per collection. Each line is tagged Scavenge or Mark-sweep, showing the heap sizes before and after, and how long the pause took. It is the fastest way to see how often you are collecting and how long the pauses run, all without touching your code.
--expose-gc exposes global.gc() so you can force a collection by hand. It is useful in experiments. You can trigger a collection to get a clean memory baseline, or check whether memory you suspect is reclaimable actually goes away. Keep this out of production, where manual collections only get in the engine's way.
Heap snapshots are the real leak-hunting tool. Run Node.js with --inspect, open chrome://inspect, and take a snapshot from the Memory tab. Take one snapshot, exercise the suspected leak, and take a second. Use the comparison view to see exactly which objects were retained between them and the retainer path holding each one alive. That path is the reference you need to break. You can also dump a snapshot on demand by starting your process with --heapsnapshot-signal=SIGUSR2, or from inside the code with v8.writeHeapSnapshot().
For continuous monitoring, a PerformanceObserver watching gc entries gives you pause data with almost no overhead. You can easily ship this data to your metrics backend.
console.log(`${kind[entry.detail.kind]} took ${entry.duration.toFixed(2)}ms`);
}
});
observer.observe({entryTypes:["gc"]});
javascript
Each callback fires after a collection with its kind and duration. This lets you watch minor and major pauses separately and set up alerts when the major pauses get too long.
Practical tuning
The setting people reach for first is --max-old-space-size=<MB>, which sets the ceiling on old space. On a 64-bit machine, that defaults to roughly two gigabytes, and recent Node.js versions size it based on the memory actually available to the process. New space is governed separately by --max-semi-space-size, but you rarely need to touch that one.
Raising the old-space limit helps when your workload needs more live memory. This might be a large in-memory dataset or a cache you have already bounded that simply needs to be big. Giving it room means the data fits and major collections run less often.
Raising the limit does nothing for a leak. If memory climbs without bound, a bigger heap just means the process takes longer to die. When the major collection finally runs, it has more memory to scan, so the pauses get worse before the crash. You have bought time, not a fix. Find and bound the leak first, then decide whether you still need more heap space.
Containers add a trap. Node.js might read the host machine's total RAM rather than the container's cgroup limit. It can then size its heap above what the container is actually allowed to use. When that happens, the kernel OOM-kills the process with no JavaScript error at all. The process just vanishes. In a container, set --max-old-space-size explicitly so it sits comfortably under the memory limit.
Often, the right move is to not tune anything at all. If your p50 response time is fine and memory is stable across collections, the defaults are well chosen. Reaching for flags is premature. The garbage collector does more for you than almost any other part of the runtime, and most days you can leave it alone.
Start watching it the day memory climbs or your p99 starts to wobble. Using --trace-gc and a pair of heap snapshots will usually tell you within minutes whether you have a leak to fix or a limit to raise.